All Activity
- Today
-
List of SG Property Articles: Singapore Property Insights on HDB, Condos, BTO, Resale Prices, ABSD, Lease Decay, and Buying/Selling Strategies SG Property Article 1: The 3 Certainties of Property Transformation: A Professional Framework for Timing Your Entry https://www.geomancy.net/forums/topic/20897-the-3-main-signs-of-property-change-when-to-step-in-and-buy/ SG Property Article 2: A practical pro and cons review of how Singapore poperty is often assessed and sometimes marketed by real estate agents https://www.geomancy.net/forums/topic/20898-a-practical-pro-and-cons-review-of-how-singapore-property-is-often-assessed-and-sometimes-marketed-by-real-estate-agents/ SG Property Article 3: Boutique condos in Singapore are often ignored https://www.geomancy.net/forums/topic/20904-boutique-condos-in-singapore-are-often-ignored-because-most-buyers-focus-on-big-high-unit-projects-but-they-can-offer-strong-long-term-value/ SG Property Article 4: BTO is coming, so when should you sell? https://www.geomancy.net/forums/topic/20903-bto-is-coming-so-when-should-you-sell/ SG Property Article 5: A buyer playbook using MAPS Investment screening process https://www.geomancy.net/forums/topic/20900-a-buyer-playbook-using-maps-investment-screening-process/ SG Property Article 6: Why 2026 matters for HDB owners who want to upgrade https://www.geomancy.net/forums/topic/20902-why-2026-matters-for-hdb-owners-who-want-to-upgrade-to-private-property-without-depleting-personal-savings/ SG Property Article 7: Is your HDB a starting point for upgrading to private property? https://www.geomancy.net/forums/topic/20908-sg-property-article-7-your-hdb-is-your-starting-point/ SG Property Article 8: Reckless housing land bids? https://www.geomancy.net/forums/topic/20912-sg-property-article-8-reckless-housing-land-bids/ SG Property Article 9: HDB resale prices post first decline in nearly seven years https://www.geomancy.net/forums/topic/20919-sg-property-article-9-hdb-resale-prices-post-first-decline-in-nearly-seven-years/ SG Property Article 10: Ten Reasons why HDB Homeowners sell their flats https://www.geomancy.net/forums/topic/20942-sg-property-article-10-why-hdb-homeowners-sell-their-flats-and-what-it-says-about-life-in-singapore/ SG Property Article 11: Educational Infographic Ads Designed to Boost Engagement https://www.geomancy.net/forums/topic/20962-sg-property-article-11-educational-infographic-ads-designed-to-boost-engagement/ SG Property Article 12: A critical review of the common unit selection framework https://www.geomancy.net/forums/topic/20899-a-critical-review-of-the-common-unit-selection-framework-made-popular-by-singapore-property-influencers-and-agents/ SG Property Article 13: Condo owners may lose their apartment for owing maintenance charges https://www.geomancy.net/forums/topic/20952-condo-owners-may-lose-their-apartment-for-owing-maintenance-charges/ SG Property Article 14: HDB Lease Decay - By 2030, close to 500,000 HDB flats will be older than 40 years https://www.geomancy.net/forums/topic/20969-sg-property-article-14-hdb-lease-decay-by-2030-close-to-500000-hdb-flats-will-be-older-than-40-years/ SG Property Article 15: Failed “99-1” ownership scheme leads to costly lawsuit, highlighting stricter IRAS scrutiny and risks of trying to bypass Singapore’s ABSD https://www.geomancy.net/forums/topic/20878-sg-property-article-15-failed-99-1-ownership-scheme-leads-to-costly-lawsuit-highlighting-stricter-iras-scrutiny-and-risks-of-trying-to-bypass-singapores-absd/ SG Property Article 16: Star Buy Units in New Launch Condos: What They Really Mean + 5-Factor Checklist to Spot a Genuine Deal https://www.geomancy.net/forums/topic/20994-sg-property-article-16-star-buy-units-in-new-launch-condos-what-they-really-mean-5-factor-checklist-to-spot-a-genuine-deal/ SG Property Article 17: When Should You Sell Your HDB Before getting a New BTO? (The 3-Phase Strategy That Avoids Rental Gaps) https://www.geomancy.net/forums/topic/21010-sg-property-article-17-when-should-you-sell-your-hdb-before-getting-a-new-bto-the-3-phase-strategy-that-avoids-rental-gaps/ SG Property Article 18: Cash vs CPF for Your Home Loan in Singapore: Which Payment Method Leaves You Better Off (Now and When You Sell)? https://www.geomancy.net/forums/topic/21013-sg-property-article-18-cash-vs-cpf-for-your-home-loan-in-singapore-which-payment-method-leaves-you-better-off-now-and-when-you-sell/


-
Expecting to give birth soon and need a caesarean delivery or induced labor?
URL: Learn more about our Selecting the Birth Date for a Caesarean Delivery Services
Our Selecting the Birth Date for a Caesarean Delivery service can help you choose the best date and time to give your child optimal Ba Zi luck.
Key Features
Comprehensive search into the hour by hour analysis for each day to find the best date and time for the date range of your expected delivery date (ie 1 Jan - 31 Jan etc)
Narrows search to finding dates which have ALL HOURS Auspicious timing so that should there be any "unexpected" delays in caesarean operation, the child is still good.
Identifies the best hours with the most well balanced five element percentage to minimize potential health issues.
Identifies the Key Character Traits for each hour to help you look for a good overall trait for the child.


Robert Lee, +65 9835-5734 / support@geomancy.net
Learn more about our Selection of Caesarean Date Services
Sample Reports
https://www.geomancy.net/demoreports/caesarean_dates/caesarean_date_summary.html
https://www.geomancy.net/demoreports/caesarean_dates/caesarean_date_summary_list.html
Information Required (To begin, fill up this Form...)
From 148.00 USD -
Selecting an Auspicious Chinese Name for your Newborn baby
URL: Learn more about our Choosing An Auspicious Chinese Name for your Newborn
Key Features
Our comprehensive name analysis service helps you find the best possible name for your baby
Includes comprehensive Ba Zi Review to determine the whether the name is suitable to the child or not
We will attempt to find the best name stroke group for your surname, and then work out as many possible name combinations for you to be able to find the most suitable name.
In addition, you can also match out your preferred name from a character reference list provided for each name stroke group.


Robert Lee, +65 9835-5734 / support@geomancy.net
Learn more about our Choosing An Auspicious Chinese Name for your Newborn
Information Required (Fill up this Form...)
From 228.00 USD -
Other Related Property Articles SG Property Article 1: The 3 Certainties of Property Transformation: A Professional Framework for Timing Your Entry https://www.geomancy.net/forums/topic/20897-the-3-main-signs-of-property-change-when-to-step-in-and-buy/ SG Property Article 2: A practical pro and cons review of how Singapore poperty is often assessed and sometimes marketed by real estate agents https://www.geomancy.net/forums/topic/20898-a-practical-pro-and-cons-review-of-how-singapore-property-is-often-assessed-and-sometimes-marketed-by-real-estate-agents/ SG Property Article 3: Boutique condos in Singapore are often ignored https://www.geomancy.net/forums/topic/20904-boutique-condos-in-singapore-are-often-ignored-because-most-buyers-focus-on-big-high-unit-projects-but-they-can-offer-strong-long-term-value/ SG Property Article 4: BTO is coming, so when should you sell? https://www.geomancy.net/forums/topic/20903-bto-is-coming-so-when-should-you-sell/ SG Property Article 5: A buyer playbook using MAPS Investment screening process https://www.geomancy.net/forums/topic/20900-a-buyer-playbook-using-maps-investment-screening-process/ SG Property Article 6: Why 2026 matters for HDB owners who want to upgrade https://www.geomancy.net/forums/topic/20902-why-2026-matters-for-hdb-owners-who-want-to-upgrade-to-private-property-without-depleting-personal-savings/ SG Property Article 7: Is your HDB a starting point for upgrading to private property? https://www.geomancy.net/forums/topic/20908-sg-property-article-7-your-hdb-is-your-starting-point/ SG Property Article 8: Reckless housing land bids? https://www.geomancy.net/forums/topic/20912-sg-property-article-8-reckless-housing-land-bids/ SG Property Article 9: HDB resale prices post first decline in nearly seven years https://www.geomancy.net/forums/topic/20919-sg-property-article-9-hdb-resale-prices-post-first-decline-in-nearly-seven-years/ SG Property Article 10: Ten Reasons why HDB Homeowners sell their flats https://www.geomancy.net/forums/topic/20942-sg-property-article-10-why-hdb-homeowners-sell-their-flats-and-what-it-says-about-life-in-singapore/ SG Property Article 11: Educational Infographic Ads Designed to Boost Engagement https://www.geomancy.net/forums/topic/20962-sg-property-article-11-educational-infographic-ads-designed-to-boost-engagement/ SG Property Article 12: A critical review of the common unit selection framework https://www.geomancy.net/forums/topic/20899-a-critical-review-of-the-common-unit-selection-framework-made-popular-by-singapore-property-influencers-and-agents/ SG Property Article 13: Condo owners may lose their apartment for owing maintenance charges https://www.geomancy.net/forums/topic/20952-condo-owners-may-lose-their-apartment-for-owing-maintenance-charges/ SG Property Article 14: HDB Lease Decay - By 2030, close to 500,000 HDB flats will be older than 40 years https://www.geomancy.net/forums/topic/20969-sg-property-article-14-hdb-lease-decay-by-2030-close-to-500000-hdb-flats-will-be-older-than-40-years/ SG Property Article 15: Failed “99-1” ownership scheme leads to costly lawsuit, highlighting stricter IRAS scrutiny and risks of trying to bypass Singapore’s ABSD https://www.geomancy.net/forums/topic/20878-sg-property-article-15-failed-99-1-ownership-scheme-leads-to-costly-lawsuit-highlighting-stricter-iras-scrutiny-and-risks-of-trying-to-bypass-singapores-absd/ SG Property Article 16: Star Buy Units in New Launch Condos: What They Really Mean + 5-Factor Checklist to Spot a Genuine Deal https://www.geomancy.net/forums/topic/20994-sg-property-article-16-star-buy-units-in-new-launch-condos-what-they-really-mean-5-factor-checklist-to-spot-a-genuine-deal/ SG Property Article 17: When Should You Sell Your HDB Before getting a New BTO? (The 3-Phase Strategy That Avoids Rental Gaps) https://www.geomancy.net/forums/topic/21010-sg-property-article-17-when-should-you-sell-your-hdb-before-getting-a-new-bto-the-3-phase-strategy-that-avoids-rental-gaps/ SG Property Article 18: Cash vs CPF for Your Home Loan in Singapore: Which Payment Method Leaves You Better Off (Now and When You Sell)? https://www.geomancy.net/forums/topic/21013-sg-property-article-18-cash-vs-cpf-for-your-home-loan-in-singapore-which-payment-method-leaves-you-better-off-now-and-when-you-sell/
-
Thank you very much for sharing and for your clarification too! I really appreciate you taking the time, and hope you have a great week ahead!
-
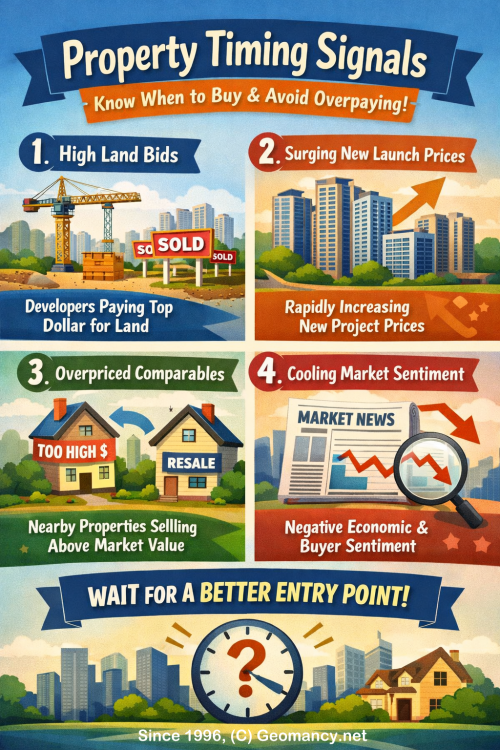
Property Market Timing Made Simple: Track Entry Prices, New Launch Benchmarks, and GLS Land Bids To time property purchases more calmly and avoid overpaying, track four repeatable signals historical entry prices, nearby new-launch benchmarks, GLS land-bid trends, and “laggard” projects priced below true comparables so you can judge whether prices are justified, where neighborhood price ceilings are forming, what developers expect next, and where value gaps may close before the crowd reacts. Key Takeaways - Don’t anchor to “today’s normal”; compare current prices to prior entry points to see if you’re early or buying after a repricing. - Ask what has changed to justify large psf increases (conditions may change, but the premium needs a reason). - Benchmark against nearby new launches because they set neighborhood price ceilings and reset expectations. - Watch for soft new-launch demand or heavy incentives as a sign local pricing power may be topping out. - Use GLS land bids (bid levels, number of bidders, bid spread vs prior sites) as a forward-looking indicator of developer confidence and future price floors. - Identify projects trading below true comparables (location/amenities/tenure positioning) to find “laggards” where gaps may close. - A “watchlist mindset” combining these signals helps buyers act earlier and avoid FOMO-driven late entries. +++ Many home buyers don’t “miss” the market because they aren’t smart they miss it because property markets are noisy, fast-moving, and full of distractions. For example, some buyers managed to enter around $1,8XX psf, while others paid $2,3XX psf later for something similar. The difference usually isn’t luck. It’s that early buyers were watching a small set of signals consistently, while most people were reacting to headlines, show flat hype, or fear of missing out after prices had already moved. One reason crucial signals get missed is that buyers often anchor to the wrong reference point. Instead of asking “Is this unit priced well versus what it historically cost to enter this kind of project?”, they ask “Is this price normal for today?” When the market rises, “normal” quietly resets higher every few months. Entry price comparison is the simplest way to avoid that trap. By comparing today’s asking price to earlier entry points for the same project (or close substitutes), you can see whether you’re buying near the front of the wave or after a big repricing. This doesn’t mean you must match the earliest buyers’ price conditions change but it does force a clearer question: what changed since then that justifies paying hundreds of dollars psf more? Another common miss is failing to benchmark against nearby new launches. Buyers sometimes treat each launch as a standalone event, but developers and agents rarely do. New launches set fresh price ceilings and reshape expectations for the entire neighborhood. Nearby new launch benchmarks help you understand whether the unit you’re considering is priced at a discount, at parity, or at a premium to brand-new competing supply nearby. If a new launch in the same area is selling higher (with smaller units, fewer incentives, or less attractive attributes), that can support the case that resale or earlier-launch projects still have room to move. On the other hand, if new launches start selling softer or need heavy incentives, that’s a warning that the area’s pricing power may be topping out even if the marketing sounds bullish. Government land bid analysis is another signal many buyers skip because it feels “too technical.” But land bids are one of the clearest forward-looking indicators. Developers don’t bid aggressively unless they believe future selling prices can support it. Tracking recent land bids, the number of bidders, the bid spread, and how those bids compare to prior sites gives clues about developer confidence and cost pressure. Higher land costs generally raise the “floor” for future launch prices, which can lift surrounding projects over time. Conversely, weaker bids, fewer participants, or sharply lower land rates can hint that developers expect slower demand ahead. You don’t need to be an analyst just paying attention to whether land is getting more expensive and more contested in your target area can help you avoid being surprised by sudden price resets. The final consideration is projects still below comparable pricing often the biggest opportunity and the easiest to overlook. Many buyers shop by what looks newest, what has the loudest marketing, or what friends are talking about. But price tends to catch up across comparable properties over time, especially when they share the same location advantages, tenant demand, or amenity ecosystem. The key is “comparable”: similar distance to MRT, similar access to schools and lifestyle nodes, similar tenure, and similar overall positioning. When a project remains priced below peers without a strong reason (like inferior connectivity, layout issues, or upcoming nuisances), it may be lagging rather than “cheap for a reason.” These laggards are often where value-driven buyers enter before the broader market notices. Putting the four together creates a simple watchlist mindset, which is what the image is really pointing to. Entry price comparison tells you whether you’re early or late. Nearby new launch benchmarks tell you how the neighborhood’s price narrative is evolving. Government land bid analysis tells you what developers believe about tomorrow’s prices. And identifying projects still below comparable pricing helps you spot gaps before they close. Buyers who consistently track these signals tend to move earlier and more calmly, while everyone else moves later usually after prices become widely discussed and psychologically “confirmed.”


-
Thank you so much! I’ve updated the report to reflect 27degrees = NE1.
-
Hi Master Cecil, Thanks for the super helpful Redhill 2025 October BTO post for young homeowners! I wanted to clarify one quick detail about Block 144A Stack 111 before my unit selection. Your sheet lists the facing as 22° (N3), but the red line drawn on the diagram actually points to 27°. Since 22° is so close to the boundary line, could you clarify if the 22° reading was intentionally adjusted towards the road/park (the main qi-mouth), or if the facing should strictly follow the physical alignment of the building's walls? I am trying to know whether it is N3 or NE1 because it changes the Period 9 chart for this stack, so your hopefully you can help here! Thank you very much!
-
Other Related Property Articles SG Property Article 1: The 3 Certainties of Property Transformation: A Professional Framework for Timing Your Entry https://www.geomancy.net/forums/topic/20897-the-3-main-signs-of-property-change-when-to-step-in-and-buy/ SG Property Article 2: A practical pro and cons review of how Singapore poperty is often assessed and sometimes marketed by real estate agents https://www.geomancy.net/forums/topic/20898-a-practical-pro-and-cons-review-of-how-singapore-property-is-often-assessed-and-sometimes-marketed-by-real-estate-agents/ SG Property Article 3: Boutique condos in Singapore are often ignored https://www.geomancy.net/forums/topic/20904-boutique-condos-in-singapore-are-often-ignored-because-most-buyers-focus-on-big-high-unit-projects-but-they-can-offer-strong-long-term-value/ SG Property Article 4: BTO is coming, so when should you sell? https://www.geomancy.net/forums/topic/20903-bto-is-coming-so-when-should-you-sell/ SG Property Article 5: A buyer playbook using MAPS Investment screening process https://www.geomancy.net/forums/topic/20900-a-buyer-playbook-using-maps-investment-screening-process/ SG Property Article 6: Why 2026 matters for HDB owners who want to upgrade https://www.geomancy.net/forums/topic/20902-why-2026-matters-for-hdb-owners-who-want-to-upgrade-to-private-property-without-depleting-personal-savings/ SG Property Article 7: Is your HDB a starting point for upgrading to private property? https://www.geomancy.net/forums/topic/20908-sg-property-article-7-your-hdb-is-your-starting-point/ SG Property Article 8: Reckless housing land bids? https://www.geomancy.net/forums/topic/20912-sg-property-article-8-reckless-housing-land-bids/ SG Property Article 9: HDB resale prices post first decline in nearly seven years https://www.geomancy.net/forums/topic/20919-sg-property-article-9-hdb-resale-prices-post-first-decline-in-nearly-seven-years/ SG Property Article 10: Ten Reasons why HDB Homeowners sell their flats https://www.geomancy.net/forums/topic/20942-sg-property-article-10-why-hdb-homeowners-sell-their-flats-and-what-it-says-about-life-in-singapore/ SG Property Article 11: Educational Infographic Ads Designed to Boost Engagement https://www.geomancy.net/forums/topic/20962-sg-property-article-11-educational-infographic-ads-designed-to-boost-engagement/ SG Property Article 12: A critical review of the common unit selection framework https://www.geomancy.net/forums/topic/20899-a-critical-review-of-the-common-unit-selection-framework-made-popular-by-singapore-property-influencers-and-agents/ SG Property Article 13: Condo owners may lose their apartment for owing maintenance charges https://www.geomancy.net/forums/topic/20952-condo-owners-may-lose-their-apartment-for-owing-maintenance-charges/ SG Property Article 14: HDB Lease Decay - By 2030, close to 500,000 HDB flats will be older than 40 years https://www.geomancy.net/forums/topic/20969-sg-property-article-14-hdb-lease-decay-by-2030-close-to-500000-hdb-flats-will-be-older-than-40-years/ SG Property Article 15: Failed “99-1” ownership scheme leads to costly lawsuit, highlighting stricter IRAS scrutiny and risks of trying to bypass Singapore’s ABSD https://www.geomancy.net/forums/topic/20878-sg-property-article-15-failed-99-1-ownership-scheme-leads-to-costly-lawsuit-highlighting-stricter-iras-scrutiny-and-risks-of-trying-to-bypass-singapores-absd/ SG Property Article 16: Star Buy Units in New Launch Condos: What They Really Mean + 5-Factor Checklist to Spot a Genuine Deal https://www.geomancy.net/forums/topic/20994-sg-property-article-16-star-buy-units-in-new-launch-condos-what-they-really-mean-5-factor-checklist-to-spot-a-genuine-deal/ SG Property Article 17: When Should You Sell Your HDB Before getting a New BTO? (The 3-Phase Strategy That Avoids Rental Gaps) https://www.geomancy.net/forums/topic/21010-sg-property-article-17-when-should-you-sell-your-hdb-before-getting-a-new-bto-the-3-phase-strategy-that-avoids-rental-gaps/ SG Property Article 19: Property Market Timing Made Simple: Track Entry Prices, New Launch Benchmarks, and GLS Land Bids https://www.geomancy.net/forums/topic/21015-sg-property-article-19-property-market-timing-made-simple-track-entry-prices-new-launch-benchmarks-and-gls-land-bids/
-
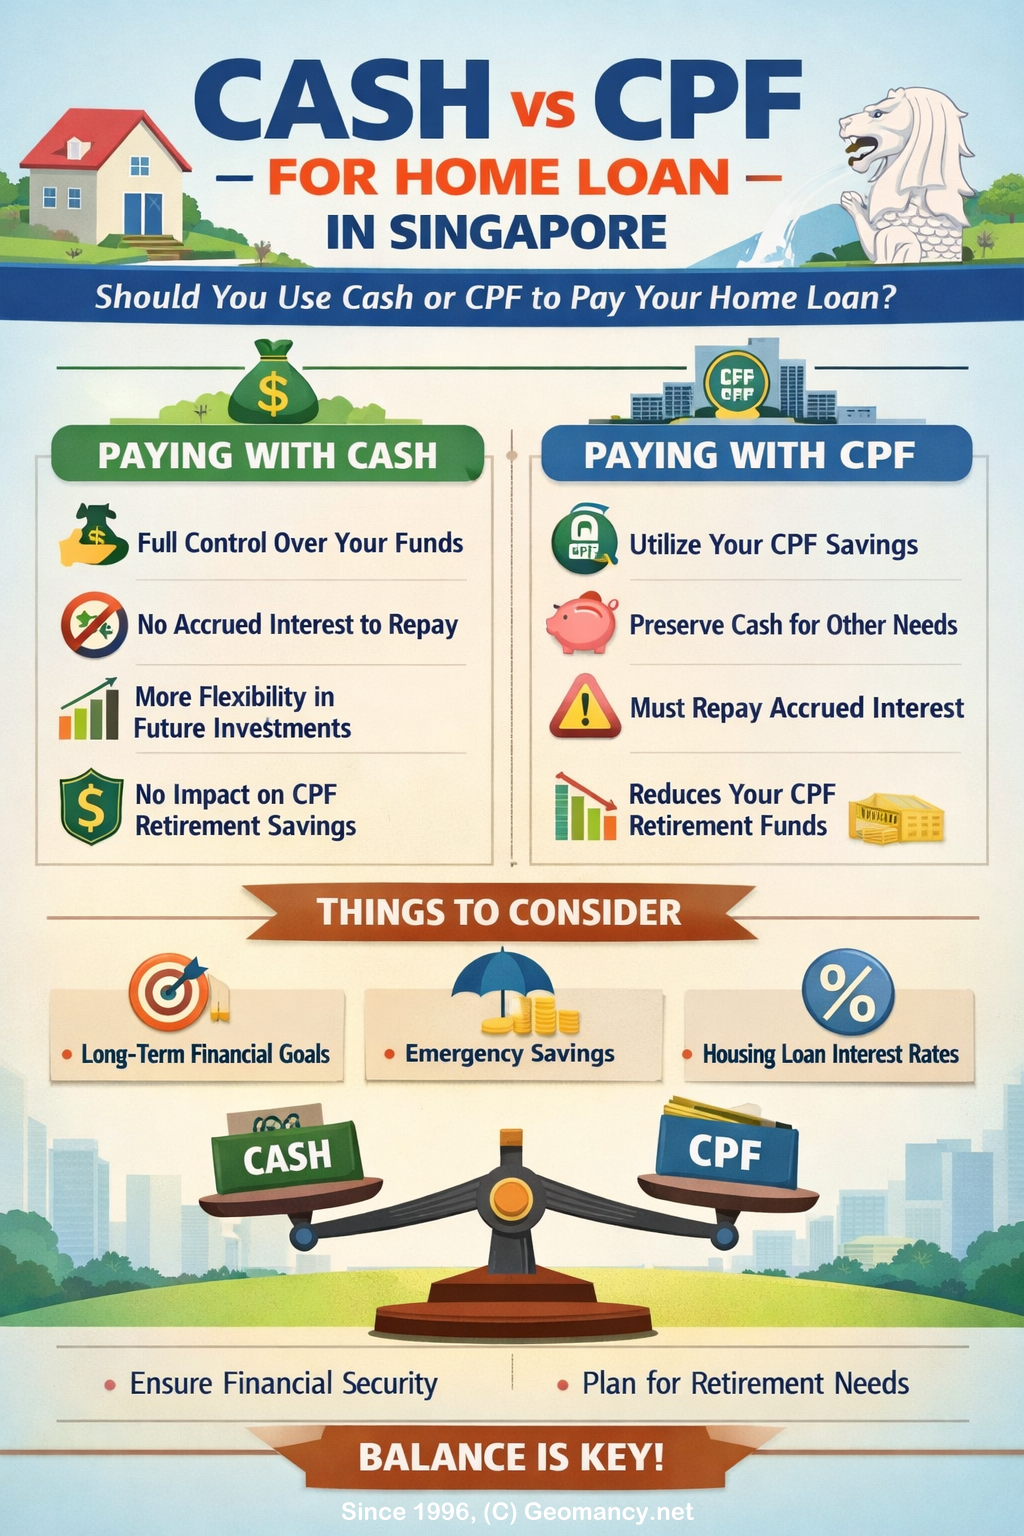
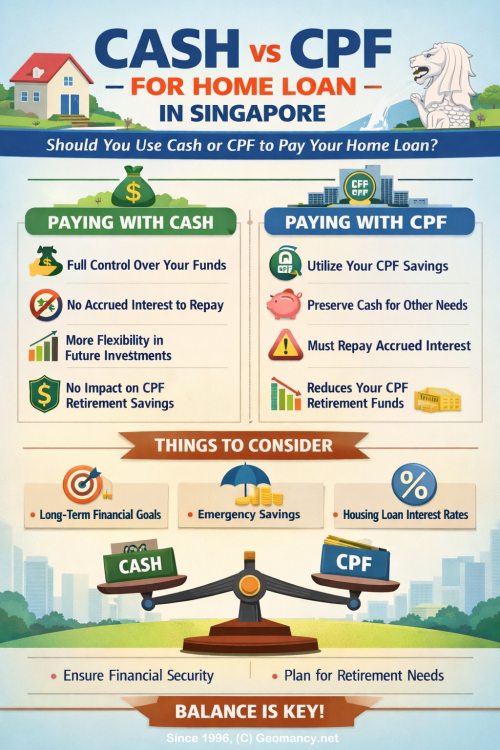
Cash vs CPF for Your Home Loan in Singapore: Which Payment Method Leaves You Better Off (Now and When You Sell)? Choosing whether to pay your monthly home loan with cash or CPF Ordinary Account (OA) isn’t only about affordability today. It affects your monthly cashflow, your future CPF balance, and how much cash you may actually keep if you sell your home later. Many homeowners use a mix of both based on their stage of life and risk comfort. Using CPF (OA) is mainly about easing pressure now. It reduces your out-of-pocket spending, helps if income is tight or variable, and lets you keep more cash available for emergencies and day-to-day needs. The trade-off is that the CPF you use for housing is typically refunded on sale (principal plus accrued interest), so you may see less “free cash” from the sale proceeds because CPF gets paid back first. Using cash is mainly about protecting your long-term CPF position. Your CPF OA stays higher and continues earning interest, supporting retirement planning. If you sell later, using less CPF can mean a smaller CPF refund, which may leave you with more cash proceeds (all else equal). The downside is a tighter monthly budget and a greater need for a strong emergency fund and spending discipline. In practice, the “best” choice depends on your situation. Lean toward CPF if you need monthly breathing room, are still building your emergency buffer, or want lower short-term stress. Lean toward cash if your income is stable, you already have a solid cash buffer, and you want to preserve CPF for retirement and potentially keep more cash upon sale. A common middle path is to use both: pay a baseline amount with CPF to keep monthly stress manageable, then top up with cash when income is strong. This blended approach can balance short-term comfort with long-term CPF preservation and flexibility if you plan to sell, upgrade, or face income changes. Bottom line: CPF can make life easier now but can reduce sale cash later due to CPF refund + accrued interest. Cash can strengthen CPF long-term and potentially leave more sale proceeds in cash, but demands stronger cashflow. For many households, a CPF + cash mix is the most sustainable option.


-
Vivianlow111 joined the community
-
More

-
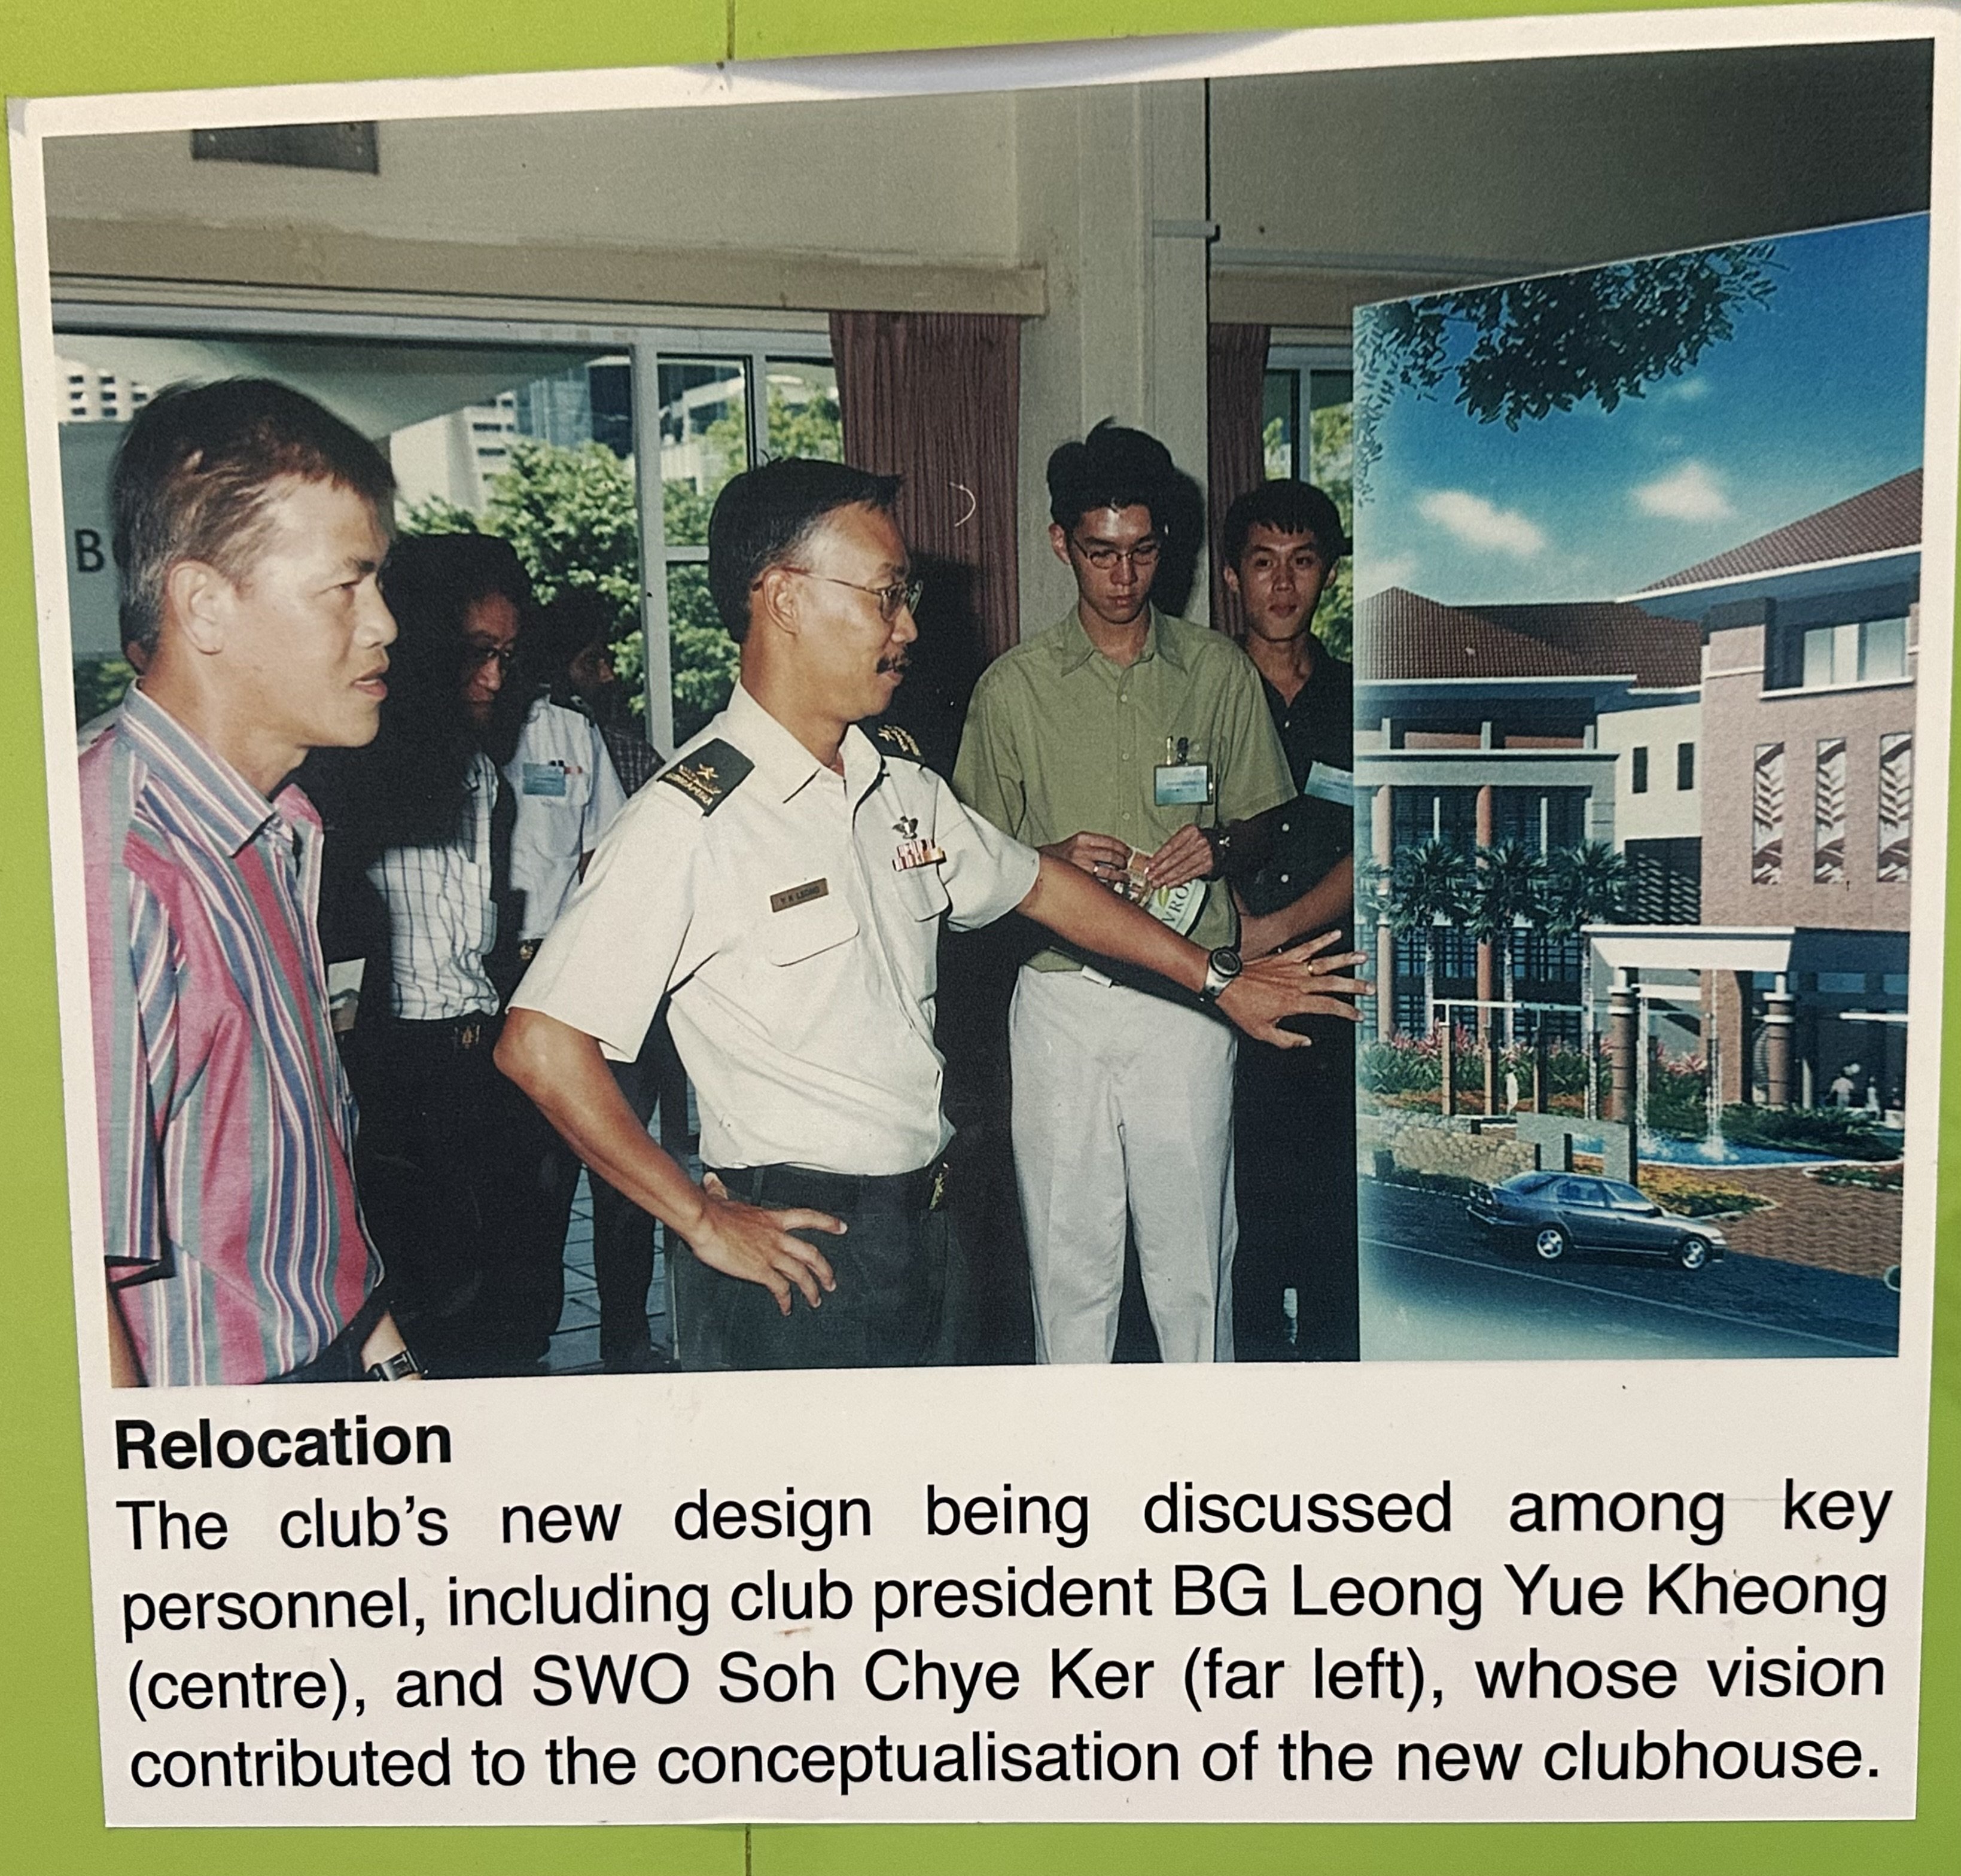
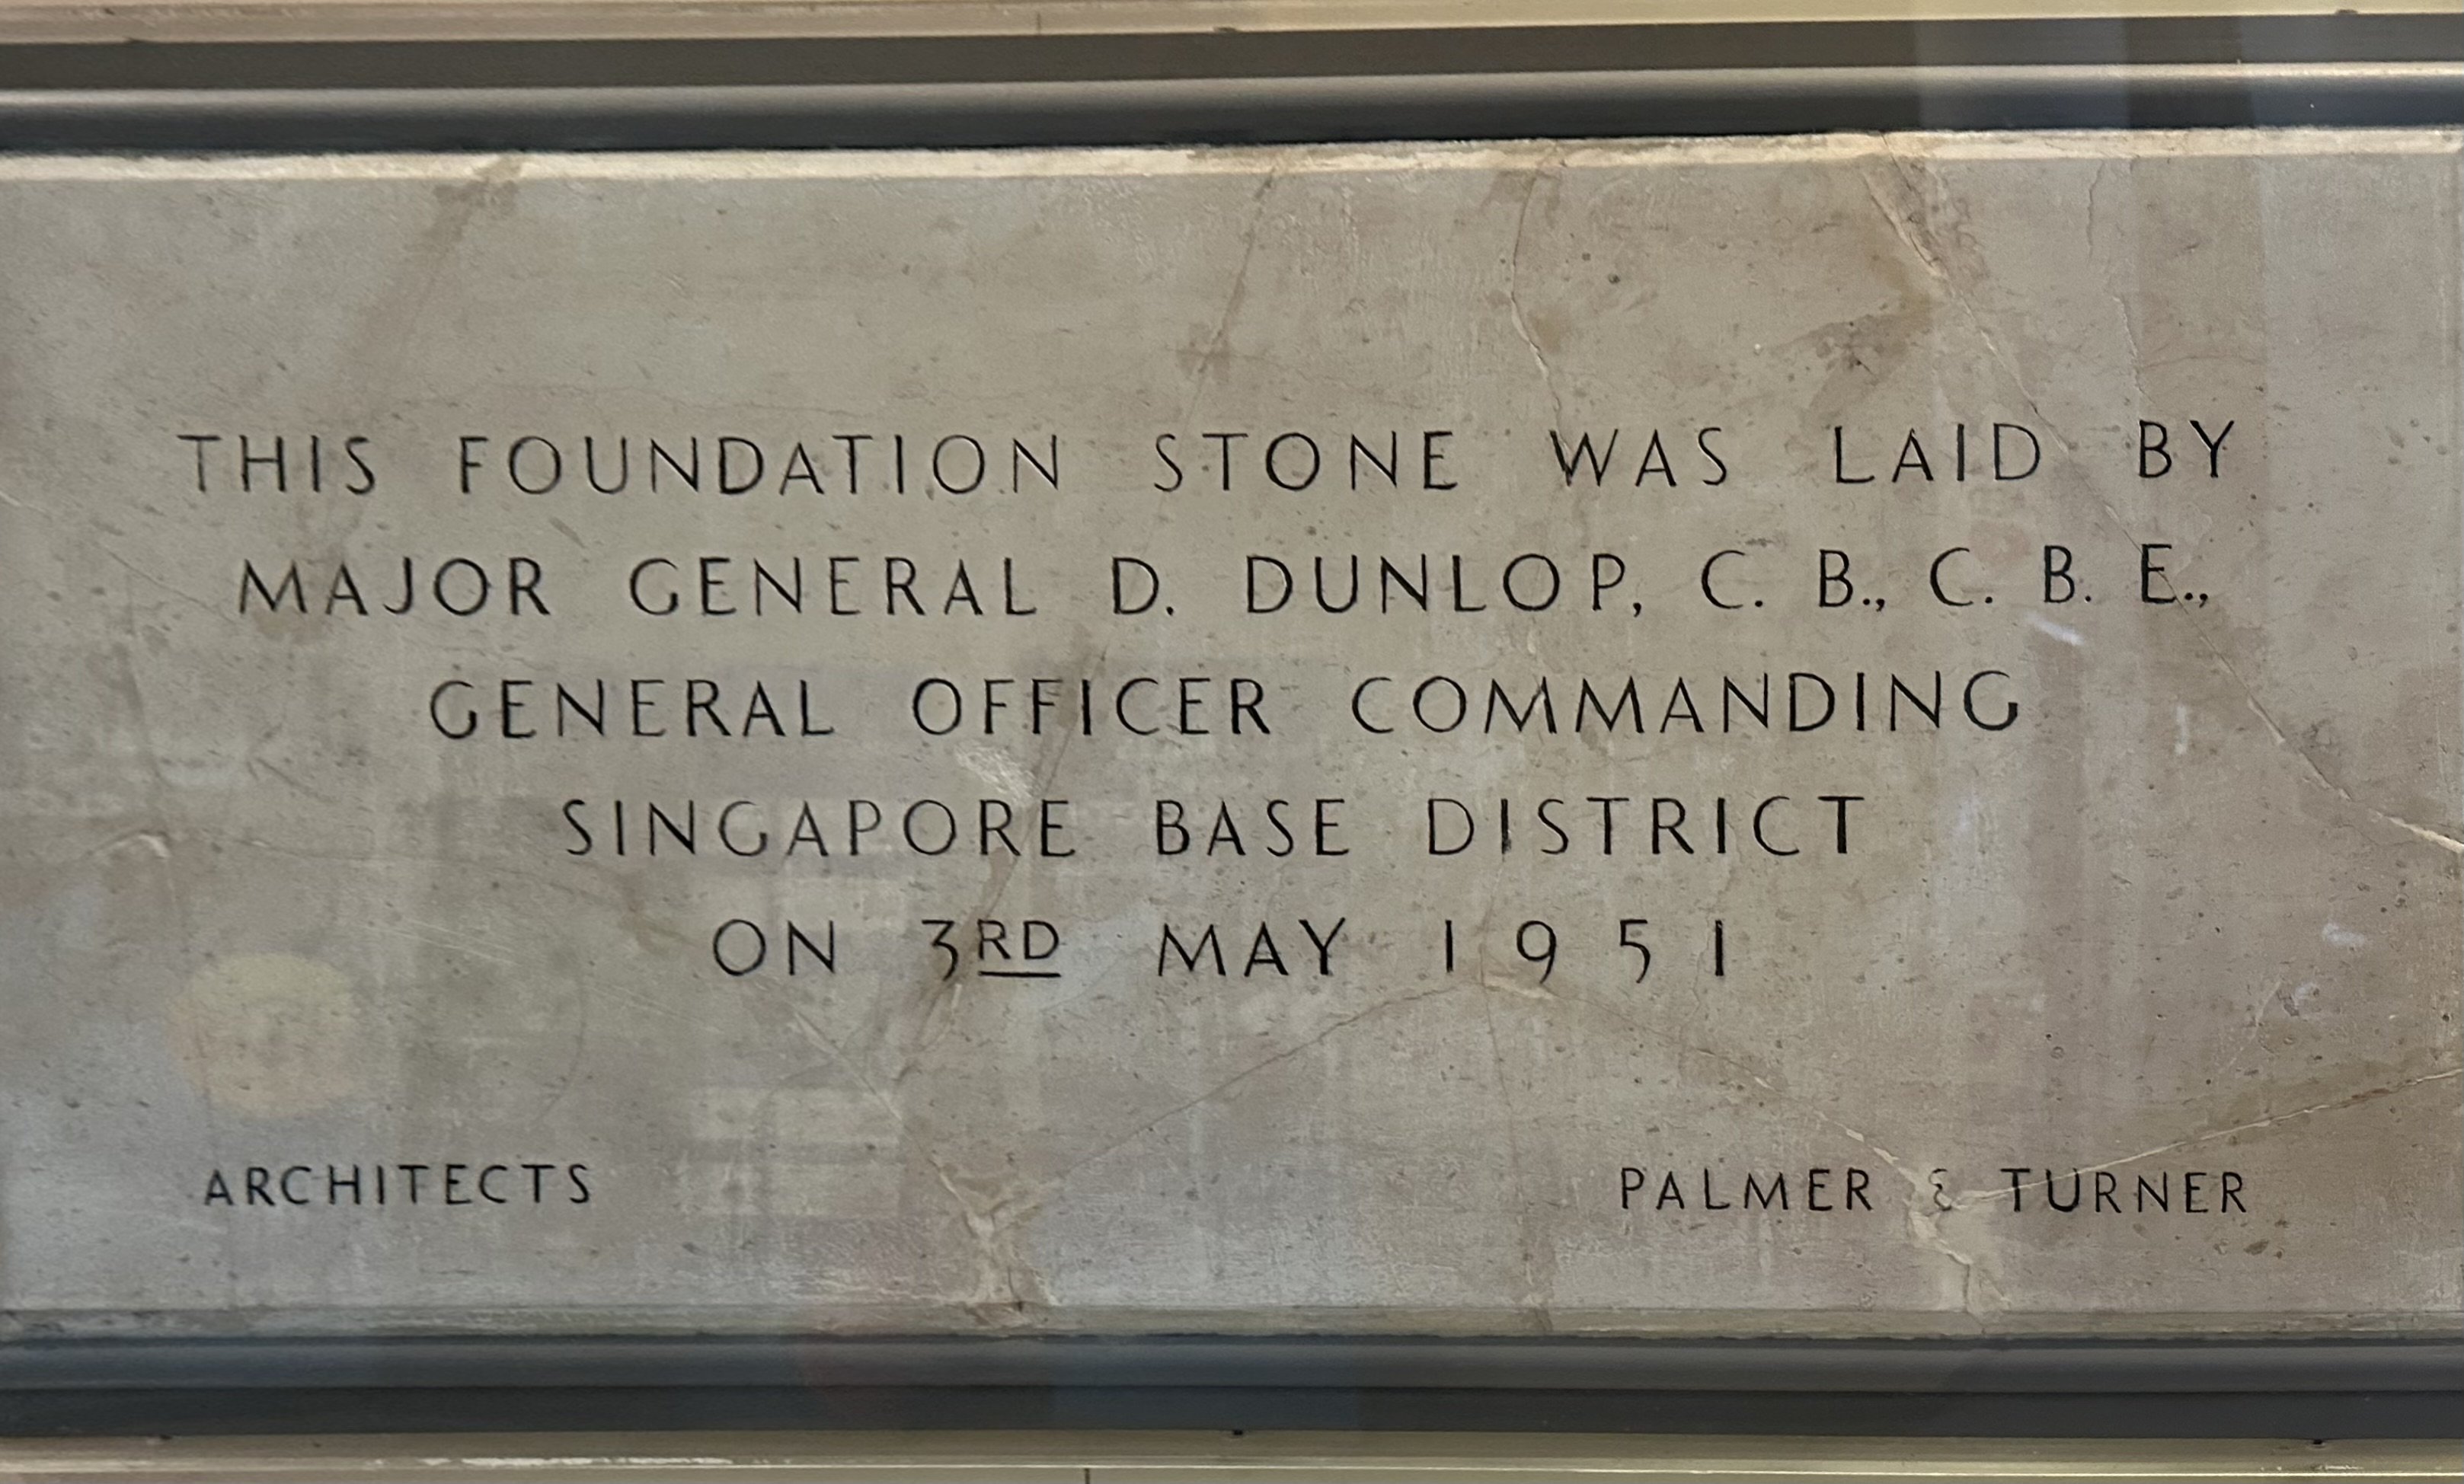
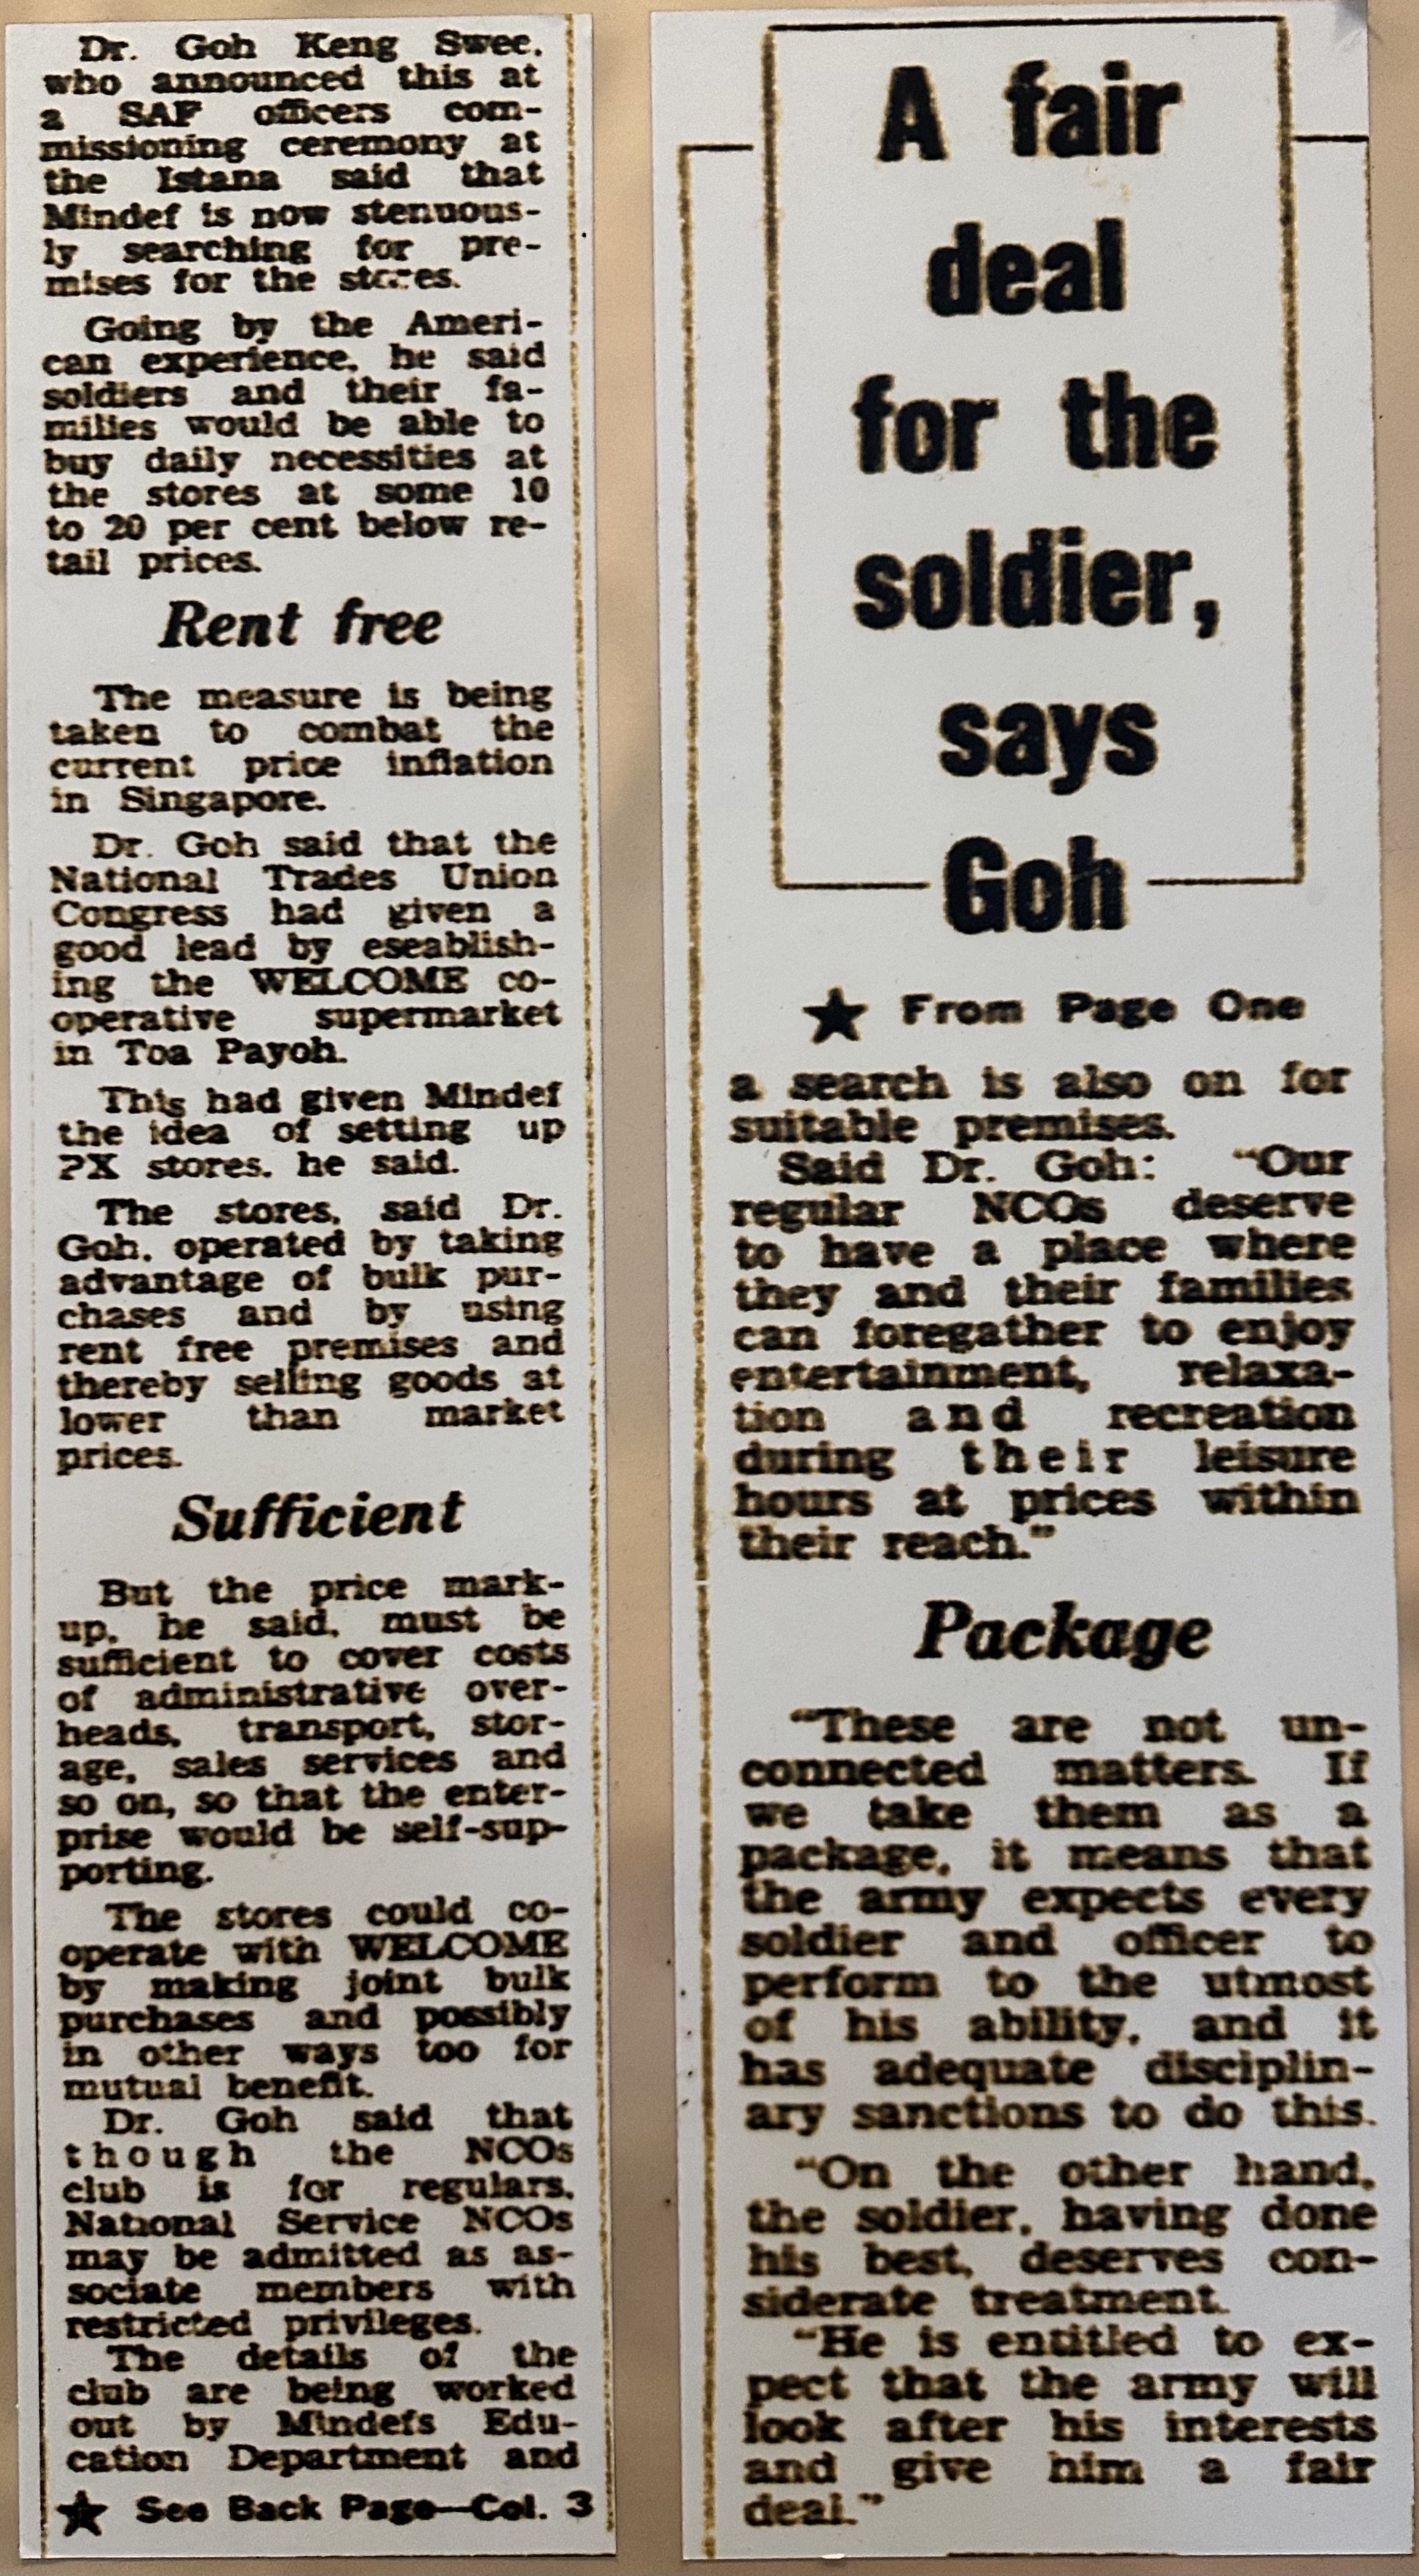
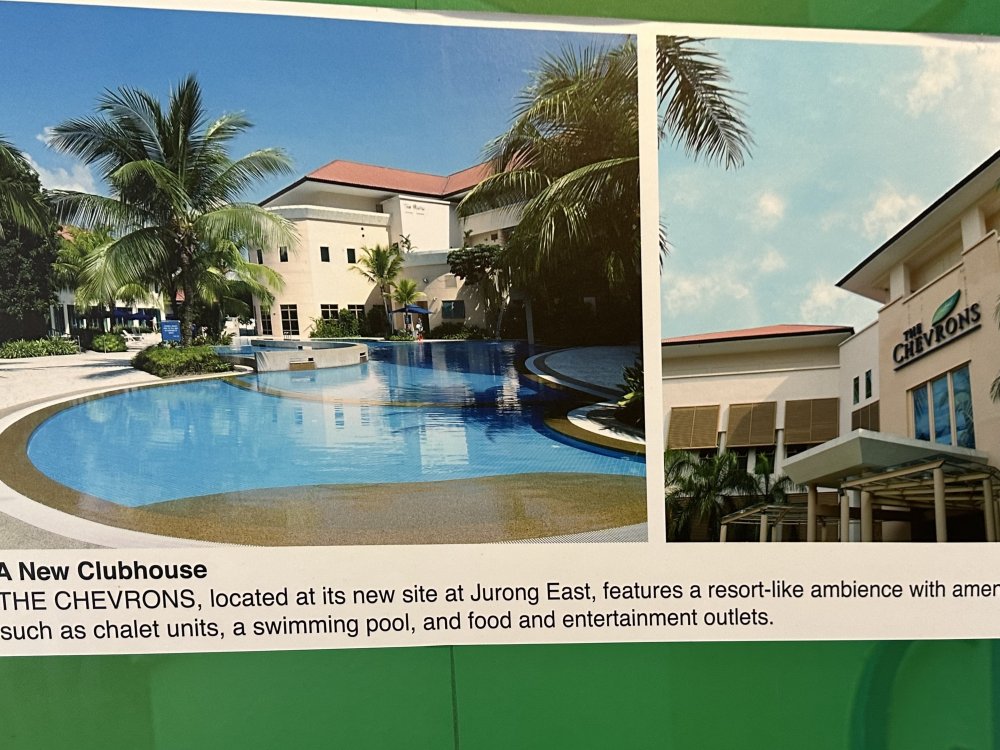
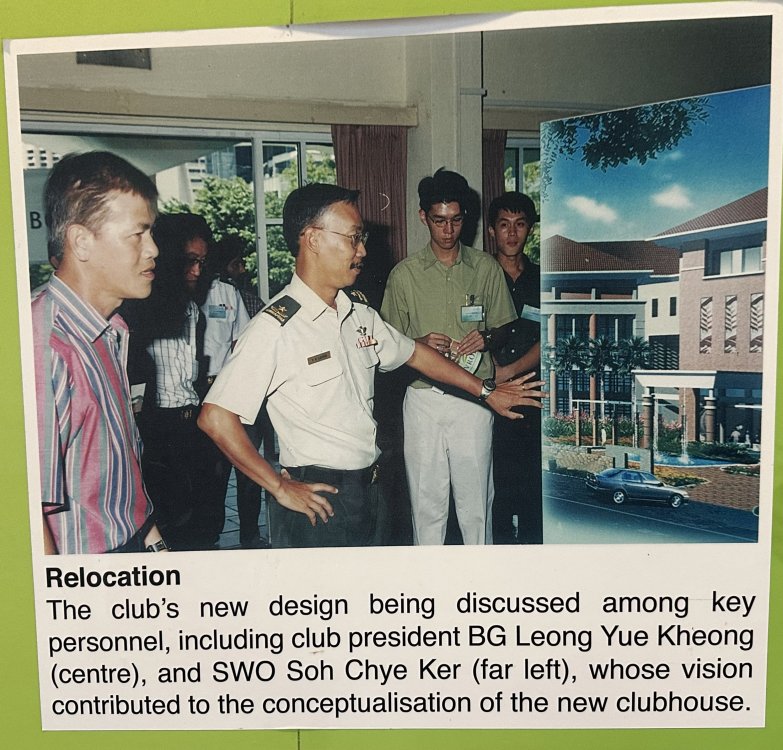
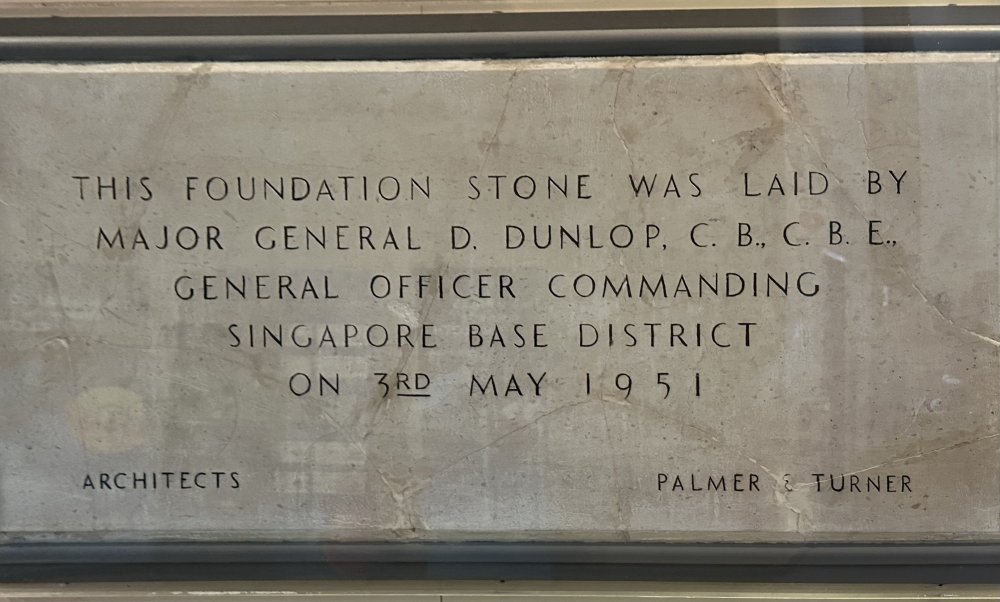
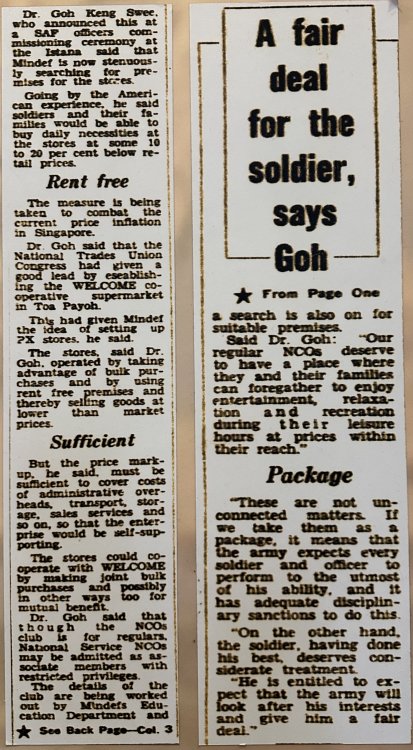
The Chevron


-
The Chevron NCO Club


- Yesterday
-
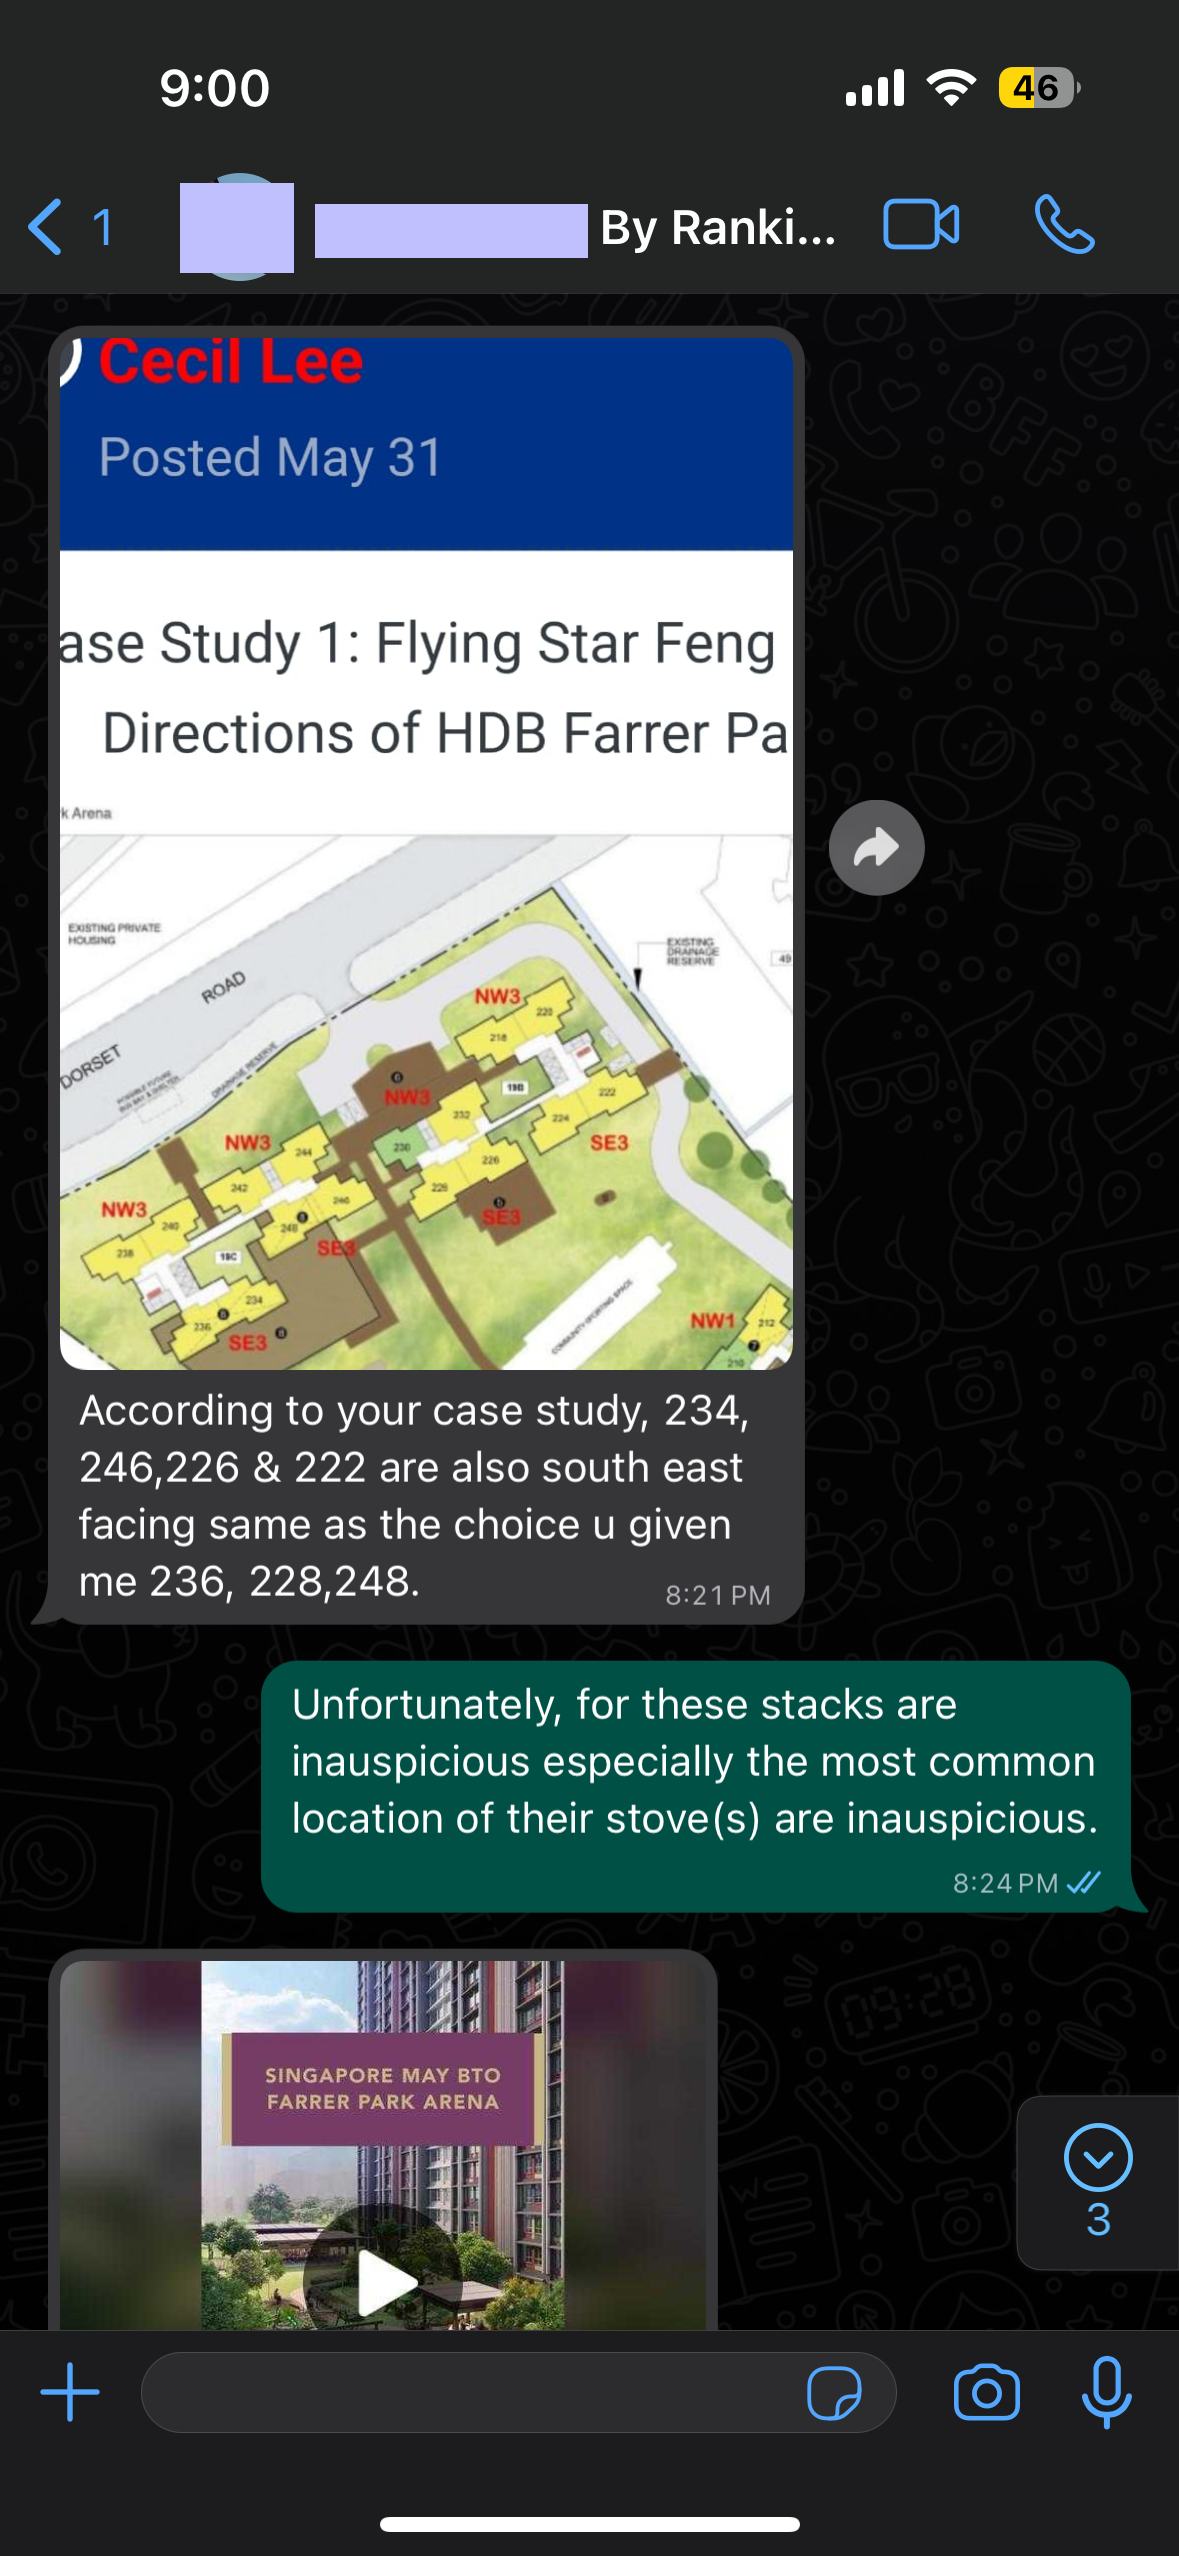
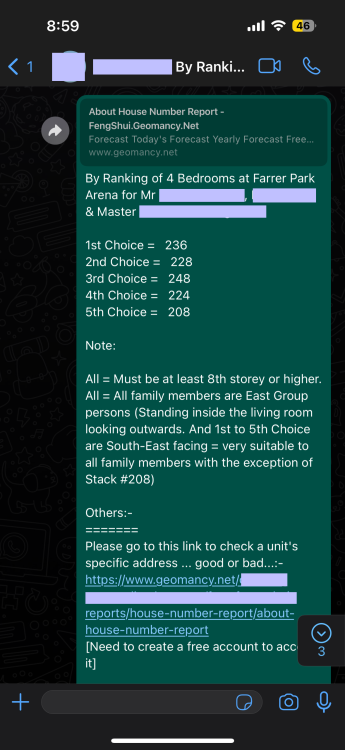
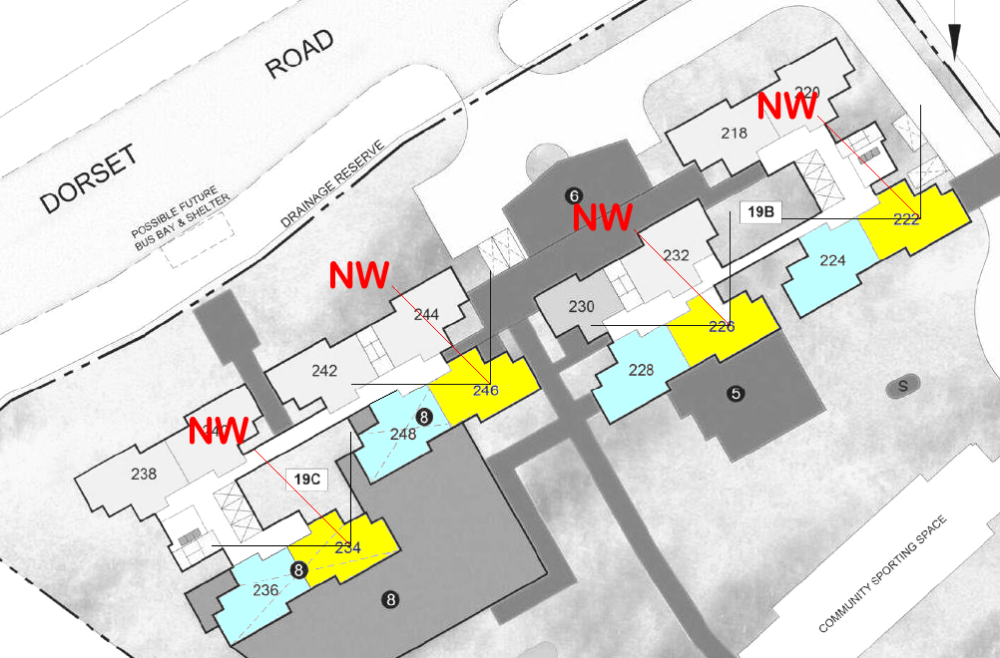
Why a Tik Tok Feng Shui Master’s Feng Shui Ranking Recommendation Can Be Wrong About this Case Study A client asked why my top-five HDB Farrer Park Arena stack rankings did not include stacks recommended in a TikTok by another Feng Shui Master. I explained I excluded those stacks because they have major Feng Shui flaws. Although stacks like #222, #226, #234, and #240 may look attractive and have similar facings to my top picks, their kitchen layout likely forces the stove into the NW sector (“Fire at Heaven’s Gate”), which is why they should be avoided. +++ Yellow Stacks #234, #246, #226, and #222 affected by unlucky Fire at Heaven's Gate +++ Case Study: Completed the ranking of 4 Bedrooms at Farrer Park Arena for the client on 31 October 2023 Client: Thank you Master Cecil, i got some burning questions, is it ok to ask u. Client: According to your case study, 234, 246, 226 & 222 are also south east facing same as the choice u given me 236, 228, 248 Client: "so master so am i right to say what is shared in the video above is not true? this is shared with me by a friend" (The client forwarded the TikTok video where the Feng Shui Master recommends stacks 234, 246, 226, and 222 as his choices, but I avoided these stacks. Why?) The FS master can plot a Flying Star chart but forgot that the kitchen especially the stove is at NW = Fire at Heaven's Gate. What kind of FS advice is he giving people? He Sabo many people.. LOL If the Feng Shui Master has done his homework properly, my client would not have any "burning" questions. LOL Did you buy any units in these stacks: 234, 246, 226, and 222, suggested by the Master in the "purple" TikTok video? Reference:


-
Why a Tik Tok Feng Shui Master’s Feng Shui Ranking Recommendation Can Be Wrong About this Case Study A client asked why my top-five HDB Farrer Park Arena stack rankings did not include stacks recommended in a TikTok by another Feng Shui Master. I explained I excluded those stacks because they have major Feng Shui flaws. Although stacks like #222, #226, #234, and #240 may look attractive and have similar facings to my top picks, their kitchen layout likely forces the stove into the NW sector (“Fire at Heaven’s Gate”), which is why they should be avoided. +++ Yellow Stacks #234, #246, #226, and #222 affected by unlucky Fire at Heaven's Gate +++ Case Study: Completed the ranking of 4 Bedrooms at Farrer Park Arena for the client on 31 October 2023 Client: Thank you Master Cecil, i got some burning questions, is it ok to ask u. Client: According to your case study, 234, 246, 226 & 222 are also south east facing same as the choice u given me 236, 228, 248 Client: "so master so am i right to say what is shared in the video above is not true? this is shared with me by a friend" (The client forwarded the TikTok video where the Feng Shui Master recommends stacks 234, 246, 226, and 222 as his choices, but I avoided these stacks. Why?) The FS master can plot a Flying Star chart but forgot that the kitchen especially the stove is at NW = Fire at Heaven's Gate. What kind of FS advice is he giving people? He Sabo many people.. LOL If the Feng Shui Master has done his homework properly, my client would not have any "burning" questions. LOL Did you buy any units in these stacks: 234, 246, 226, and 222, suggested by the Master in the "purple" TikTok video? Reference:
-
Ads

-
Urban Vista: Why Some Owners Made Money While Others Lost — It Was Mostly the Price They Paid A common myth in property investing is that outcomes are driven mainly by timing the “right” year or picking the “right” project. The Urban Vista profitability chart tells a less glamorous, more practical story: many outcomes boil down to entry price—specifically, the purchase price per square foot (PSF) you locked in versus what the resale market eventually supported. At its simplest, the math is unforgiving: Profit (PSF) = Sale PSF − Purchase PSF Profit (Amount) ≈ (Sale PSF − Purchase PSF) × Area If two owners sell into a similar resale environment, the one who bought cheaper wins—often by a lot. > Pull-quote: “In a bounded resale market, your entry PSF largely determines whether you profit, break even, or lose.” What the Urban Vista table is really showing The chart highlights a sharp contrast: - Profited — entered as low as $1,101 psf - Lost — bought up to $1,677 psf Even without seeing every losing transaction, the mechanism is clear. When resale prices don’t rise enough to clear a high entry PSF (plus costs), losses become likely. The table rows shown are all profitable examples, and they share a common trait: their owners sold at a PSF higher than they bought. But the size of the win varies dramatically—and that variance tracks the purchase PSF more than anything else. Two owners, two outcomes: the spread explains almost everything Consider two transactions from the chart. Example A: The “bought well” owner (large profit) - 3BR (1,453 sqft) bought 22 Oct 2013 at $1,101 psf (≈ $1.60M) - Sold 12 Jan 2026 at $1,376 psf (≈ $2.00M) - Profit: +$275 psf, about $400,000 - Annualised (as shown): ~1.84% This is the classic “margin of safety” purchase. The resale PSF didn’t need to explode; it merely needed to be higher than a very favorable entry point. Example B: The “paid up” owner (small profit) - 1BR (441 sqft) bought 16 Apr 2013 at $1,575 psf (≈ $695k) - Sold 12 Feb 2026 at $1,650 psf (≈ $728k) - Profit: +$75 psf, about $32,915 - Annualised (as shown): ~0.36% Here, the resale PSF is decent, but the entry price left very little room for upside. The owner technically “profited” on paper, yet the gain is thin relative to the holding period. > Pull-quote: “When you enter near the top of what buyers will later pay, you’re not investing—you’re hoping.” Why buying at $1,677 psf can turn into losses The chart’s red label says “Lost — bought up to $1,677 psf.” The table excerpt shown doesn’t include those losing rows, but the logic doesn’t require them. Imagine an owner bought at $1,677 psf and later the market only supports $1,550 psf. That’s a −$127 psf spread. On a typical 800–900 sqft unit, that’s roughly a $100k+ gross loss—*before* paying agent fees, legal costs, and other expenses. And that “before costs” part matters, because costs are exactly what turn many small “profits” into real-world break-evens or losses. The uncomfortable truth: “Profitable” can still be a poor investment Several transactions in the table show annualised returns around 0.36% to 0.83% across roughly 12 years. Even if gross profits are positive, these annualised figures hint at an important reality: - Long holding periods + modest PSF gains = weak compounding - Once you include selling commissions, legal fees, maintenance, property tax, mortgage interest, and inflation/opportunity cost, a slim profit margin can disappear In other words, not all green numbers are good outcomes—especially after a decade. Critical review: what the chart gets right (and what it misses) What it gets right - Entry PSF is decisive when resale PSF has a practical ceiling. - The profit math is consistent: the listed Profit (PSF) aligns with Sale PSF − Purchase PSF, and Profit (Amount) broadly matches Profit (PSF) × Area. What it leaves out - Selection bias: the displayed table shows profitable examples; the “lost” claim points to data not shown here. - Gross vs net: “Profit” appears gross and may exclude meaningful costs that change the true result. - Mixed comparisons: different unit types (1BR/2BR/3BR), blocks, floors, and purchase years (2013 vs 2019) introduce noise—yet the entry-price pattern still stands out. - Why was entry PSF low? A cheap PSF can reflect stack issues, noise, low floors, layout compromises, or distressed circumstances. “Buy low” is useful advice only if the reason it’s low doesn’t impair resale demand. > Pull-quote: “PSF is the scoreboard—but the reasons behind a low PSF determine whether the ‘discount’ is real.” Conclusion: Your entry price sets your exit options The Urban Vista takeaway is not that every low-PSF purchase becomes a home run, or that every high-PSF purchase is doomed. It’s that your entry price dictates how much the market needs to do for you. If you buy well below where comparable units later transact, you can succeed even in a mediocre appreciation environment. If you buy near the upper edge of what the market will bear, your upside narrows—and costs can push you into losses. In property investing, the most “predictable” edge is rarely a perfect forecast. It’s discipline at the point of entry: don’t overpay for the same eventual resale market.


-
Why some Urban Vista owners profited while others lost: it mostly came down to entry price (PSF) The chart’s core message is mathematically simple: > Profit per square foot = Sale PSF − Purchase PSF > Profit amount ≈ (Sale PSF − Purchase PSF) × Area So even if two owners sell into a similar resale market (similar Sale PSF), the one who bought at a meaningfully lower Purchase PSF captures a larger “spread” and is far more likely to profit. Conversely, buyers who entered at a high PSF can easily lose money if resale PSFs don’t exceed their entry price (and in real life, they must also clear transaction costs). The graphic itself reinforces this with the headline claim: - Profited: entered as low as $1,101 psf - Lost: bought up to $1,677 psf If resale PSFs cluster around (say) $1,4xx–$1,6xx, then buying at ~$1,677 psf leaves little room—or none at all—for gains. Urban Vista Profitability Chart Unit Type Block Level Unit Area (sqft) Date of Purchase Purchase (PSF) Purchase Price Date of Sale Sale (PSF) Sale Price Profit (PSF) Profit (Amount) Holding Period Annualised 3BR 16 7 30 797 22 Apr 2013 1,444 1,150,000 10 Mar 2026 1,607 1,280,000 163 130,000 12y 10m 16d 0.83% 1BR 16 13 32 441 16 Apr 2013 1,575 695,085 12 Feb 2026 1,650 728,000 75 32,915 12y 9m 27d 0.36% 3BR 2 5 01 893 23 Apr 2019 1,377 1,230,000 16 Jan 2026 1,735 1,550,000 358 320,000 6y 8m 23d 3.49% 3BR 6 13 09 1,453 22 Oct 2013 1,101 1,600,000 12 Jan 2026 1,376 2,000,000 275 400,000 12y 2m 21d 1.84% 1BR 16 7 32 441 23 Apr 2013 1,515 668,606 16 Dec 2025 1,665 735,000 150 66,394 12y 8m 12d 0.75% 2BR 18 15 38 1,012 12 Sep 2013 1,216 1,230,000 11 Dec 2025 1,285 1,300,000 69 70,000 12y 2m 29d 0.45% 2BR 6 5 11 549 15 Apr 2013 1,564 858,327 10 Dec 2025 1,649 905,000 85 46,673 12y 7m 25d 0.42% 3BR 16 3 29 797 02 Dec 2013 1,366 1,088,000 27 Nov 2025 1,469 1,170,000 103 82,000 11y 11m 23d 0.61% What the table shows (and why purchase price dominates) 1) The “spread” (Sale PSF − Purchase PSF) explains the profit Look at two contrasting examples: - Big winner via low entry PSF - 3BR (Block 6, #13-09): bought at $1,101 psf, sold at $1,376 psf - Spread: +275 psf - On 1,453 sqft, that’s roughly 275 × 1,453 ≈ $399k, matching the chart’s $400k profit. - Small winner via high entry PSF - 1BR (Block 16, #13-32): bought at $1,575 psf, sold at $1,650 psf - Spread: +75 psf - On 441 sqft, that’s 75 × 441 ≈ $33k, matching $32,915. Both sold into broadly comparable resale PSFs (mid-$1,6xx), but the lower entry price created far more upside. 2) The chart’s “lost at $1,677 psf” claim fits the same logic The table itself lists only profitable examples, but the logic for losses is straightforward: - If someone bought at $1,677 psf and the resale market later supports (say) $1,550 psf, then: - Profit PSF = 1,550 − 1,677 = −127 psf (loss) - On ~800 sqft, gross loss ≈ 127 × 800 = $101,600, before transaction costs. So the “why” is not mysterious: overpaying relative to the resale ceiling compresses or eliminates the PSF spread. 3) Even “profitable” deals can be underwhelming after time and costs Notice the annualised figures in the table: many are ~0.3% to 0.8% over ~12 years. That’s already a hint that: - A small PSF spread over a long hold can look “green” in absolute dollars, - Yet perform poorly once you include taxes, commissions, legal fees, interest, maintenance, and inflation/opportunity cost. Critical review of the chart (what it gets right—and what it leaves out) What it gets right - Purchase PSF is a primary driver of outcome when the eventual resale PSF range is bounded. - The table is internally consistent: Profit (PSF) aligns with Sale PSF − Purchase PSF, and Profit (Amount) broadly aligns with Profit (PSF) × Area. Key limitations / reasons to be cautious 1. Selection bias / incomplete evidence - The table shown contains only profitable transactions (all Profit (PSF) are positive). - Yet the headline says “others lost,” implying additional rows not shown. Without those, the “lost at $1,677 psf” point is asserted, not demonstrated in this table. 2. “Profit” appears to be gross (ignores transaction costs) - Real net outcome depends on seller’s stamp duties/ABSD (if any), agent commission, legal fees, mortgage interest, maintenance, renovations, and property tax. - A deal with +$30k to +$70k gross profit over ~12 years could plausibly be net negative after costs. 3. Mixing unit types and purchase years - The rows combine 1BR/2BR/3BR, different blocks, different floors, and purchases in 2013 vs 2019. - Comparing outcomes across different unit segments can confound the “entry PSF” story with differences in unit desirability and market cycles. 4. PSF alone can mask “why” the entry price differed - Low entry PSF might reflect less favorable stacks/views, inefficient layouts, low-floor units, facing noise, or distressed sales. - So “buy low” is true—but why it was low matters for resale liquidity. 5. Annualised return shown, but not benchmarked - Without comparing to risk-free rates, inflation, or alternative assets over the same period, readers may over-interpret “profit” as “good investment.” The entry price sets your ceiling for success In the Urban Vista examples shown, the resale PSFs cluster within a relatively tight band. That makes the purchase PSF the decisive lever: - Buy materially below where the market later trades → you can profit even if the project’s long-term appreciation is modest. - Buy at the top end of what the market will later pay (e.g., the chart’s “up to $1,677 psf”) → you’re relying on further multiple expansion that may never come, and costs can push you into losses. Practical implication: if you’re underwriting a condo purchase, spend more time validating your entry price vs realistic exit PSF, not just the project’s branding or headline “future potential.”


-
What the table actually shows (loss PSF and loss amount) Unit Type Block Level Unit Area (sqft) Date of Purchase Purchase (PSF) Purchase (Price) Date of Sale Sale (PSF) Sale (Price) Loss (PSF) Loss (Amount) Holding Period Annualised 3BR 16 4 29 797 14 May 2013 1,527 1,216,433 18 Oct 2021 1,255 1,000,000 ▼272 ▼216,433 8y 5m 4d -2.3% 4BR 20 5 39 1,044 08 Apr 2013 1,448 1,511,868 24 Feb 2020 1,245 1,300,000 ▼203 ▼211,868 6y 10m 15d -2.17% 3BR 4 8 08 893 18 Apr 2013 1,522 1,360,077 20 Feb 2020 1,298 1,160,000 ▼224 ▼200,077 6y 10m 1d -2.3% 4BR 22 5 46 1,044 23 May 2013 1,513 1,580,000 17 Mar 2023 1,322 1,380,000 ▼191 ▼200,000 9y 9m 23d -1.37% 3BR 12 1 23 969 05 Jul 2013 1,354 1,312,162 15 Sep 2021 1,166 1,130,000 ▼188 ▼182,162 8y 2m 11d -1.81% 3BR 10 12 17 850 26 Aug 2013 1,493 1,269,999 20 Feb 2018 1,294 1,100,000 ▼199 ▼169,999 4y 5m 25d -3.15% The table contains 6 resale transactions (units) in Urban Vista. For each, Loss (PSF) equals Purchase PSF − Sale PSF, and Loss (Amount) equals Purchase Price − Sale Price. Loss (PSF) by unit (all negative): - 272, 203, 224, 191, 188, 199 psf Range: 188–272 psf Average: ~213 psf (1277/6) Median: ~201 psf Loss (Amount) by unit (all negative): - \$216,433; \$211,868; \$200,077; \$200,000; \$182,162; \$169,999 Range: \$169,999–\$216,433 Total loss across the 6 units: \$1,180,539 Average per unit: ~\$196,757 Median: ~\$200,039 Largest loss: - Loss PSF: 272 psf - Loss amount: \$216,433 (this matches the headline “biggest loss”) How widespread are losses within this dataset? - 6 out of 6 units (100%) show losses. - Loss amounts are tightly clustered around ~\$170k–\$216k, i.e., not one-off outliers in this small list. Critical evaluation: number of units reviewed and what can (and can’t) be concluded 1. Only 6 units are reviewed. That’s a very small sample relative to the total number of homes in a condo project, so it’s not sufficient to characterize “the project” overall. 2. The selection appears loss-only (strong selection bias). Every row is a loss, and the framing (“proof”, “biggest loss”) suggests these may be filtered examples of losing resales, not an unbiased set of all resales. Without knowing: - the total number of resales during the period, and - how many were profits vs losses, one cannot infer that most owners lost money—only that these six did. 3. Losses shown are likely understated as “true investment outcome.” The table compares prices only and likely excludes buyer stamp duty, legal fees, agent commission, loan interest, maintenance fees, and renovation costs (which would worsen results). On the other hand, it also likely excludes rental income (which could partially offset losses). So it’s not a full IRR-style performance view. Bottom line from the presented data - Units reviewed: 6 - Extent of losses within those 6: All 6 lost, typically about ~200 psf and ~\$200k each, totaling ~\$1.18M across the list. - Project-wide implication: Not established, because the sample is small and appears selective (loss-only) without the full resale universe for comparison. Here are the totals and averages computed from the 6 URBAN VISTA loss transactions shown in the table. Summary row (Totals / Averages) Unit Type Block Level Unit Area (sqft) Date of Purchase Purchase (PSF) Purchase (Price) Date of Sale Sale (PSF) Sale (Price) Loss (PSF) Loss (Amount) Holding Period Annualised TOTAL / AVG (6 units) — — — 5,597 — 1,476.17 (avg) $8,250,539 (total) — 1,263.33 (avg) $7,070,000 (total) 212.83 (avg) $1,180,539 (total) — -2.18% (avg) Additional useful averages: Average loss amount per unit: $196,756.50 Area-weighted average loss PSF (total loss ÷ total sqft): $210.92 psf ( = 1,180,539 ÷ 5,597 )

-
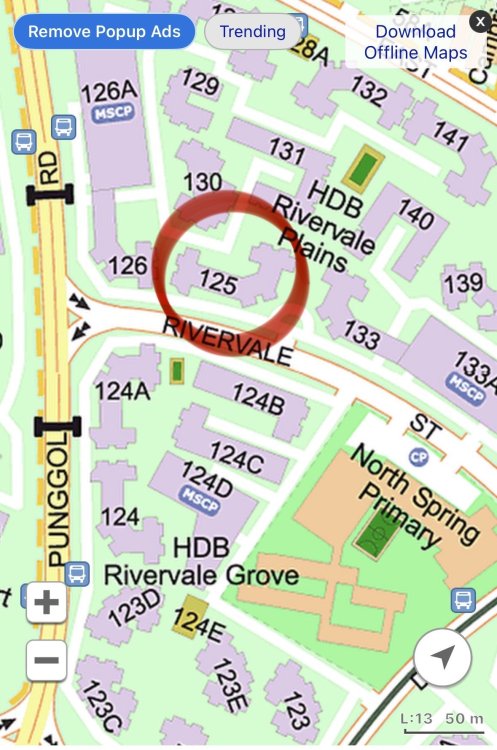
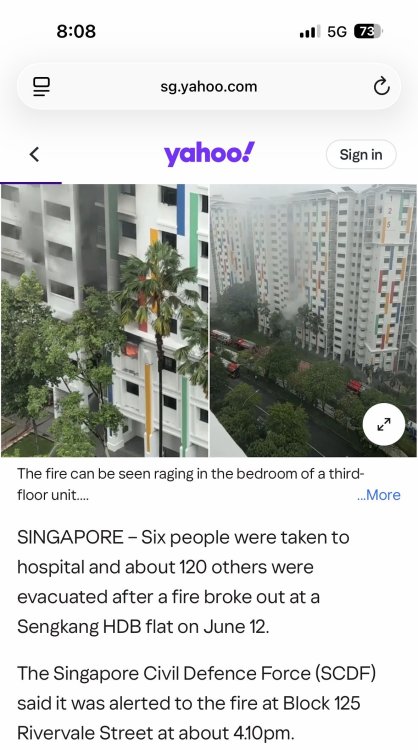
HDB Rivervale Plains Blk 125
-
Source & Credit: SINGAPORE – Six people were taken to hospital and about 120 others were evacuated after a fire broke out at a Sengkang HDB flat on June 12. The Singapore Civil Defence Force (SCDF) said it was alerted to the fire at Block 125 Rivervale Street at about 4.10pm.
- Last week
-
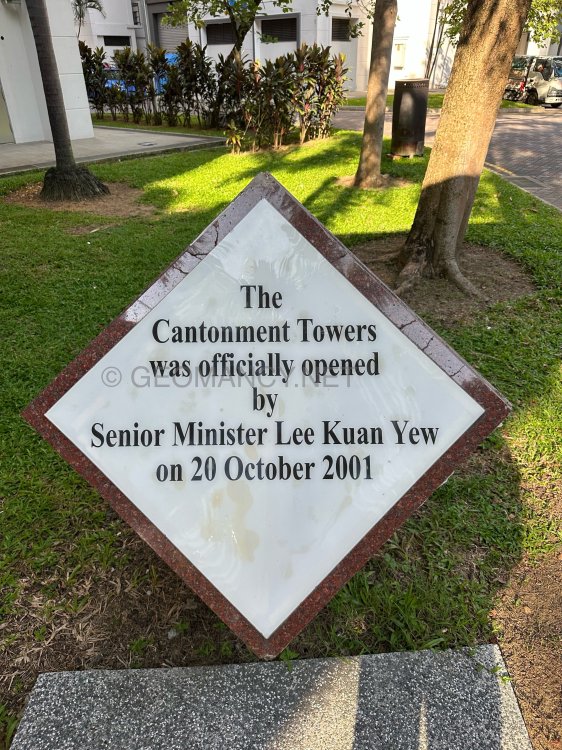
Blk 13 Cantonment Close Try lying down on me!


-
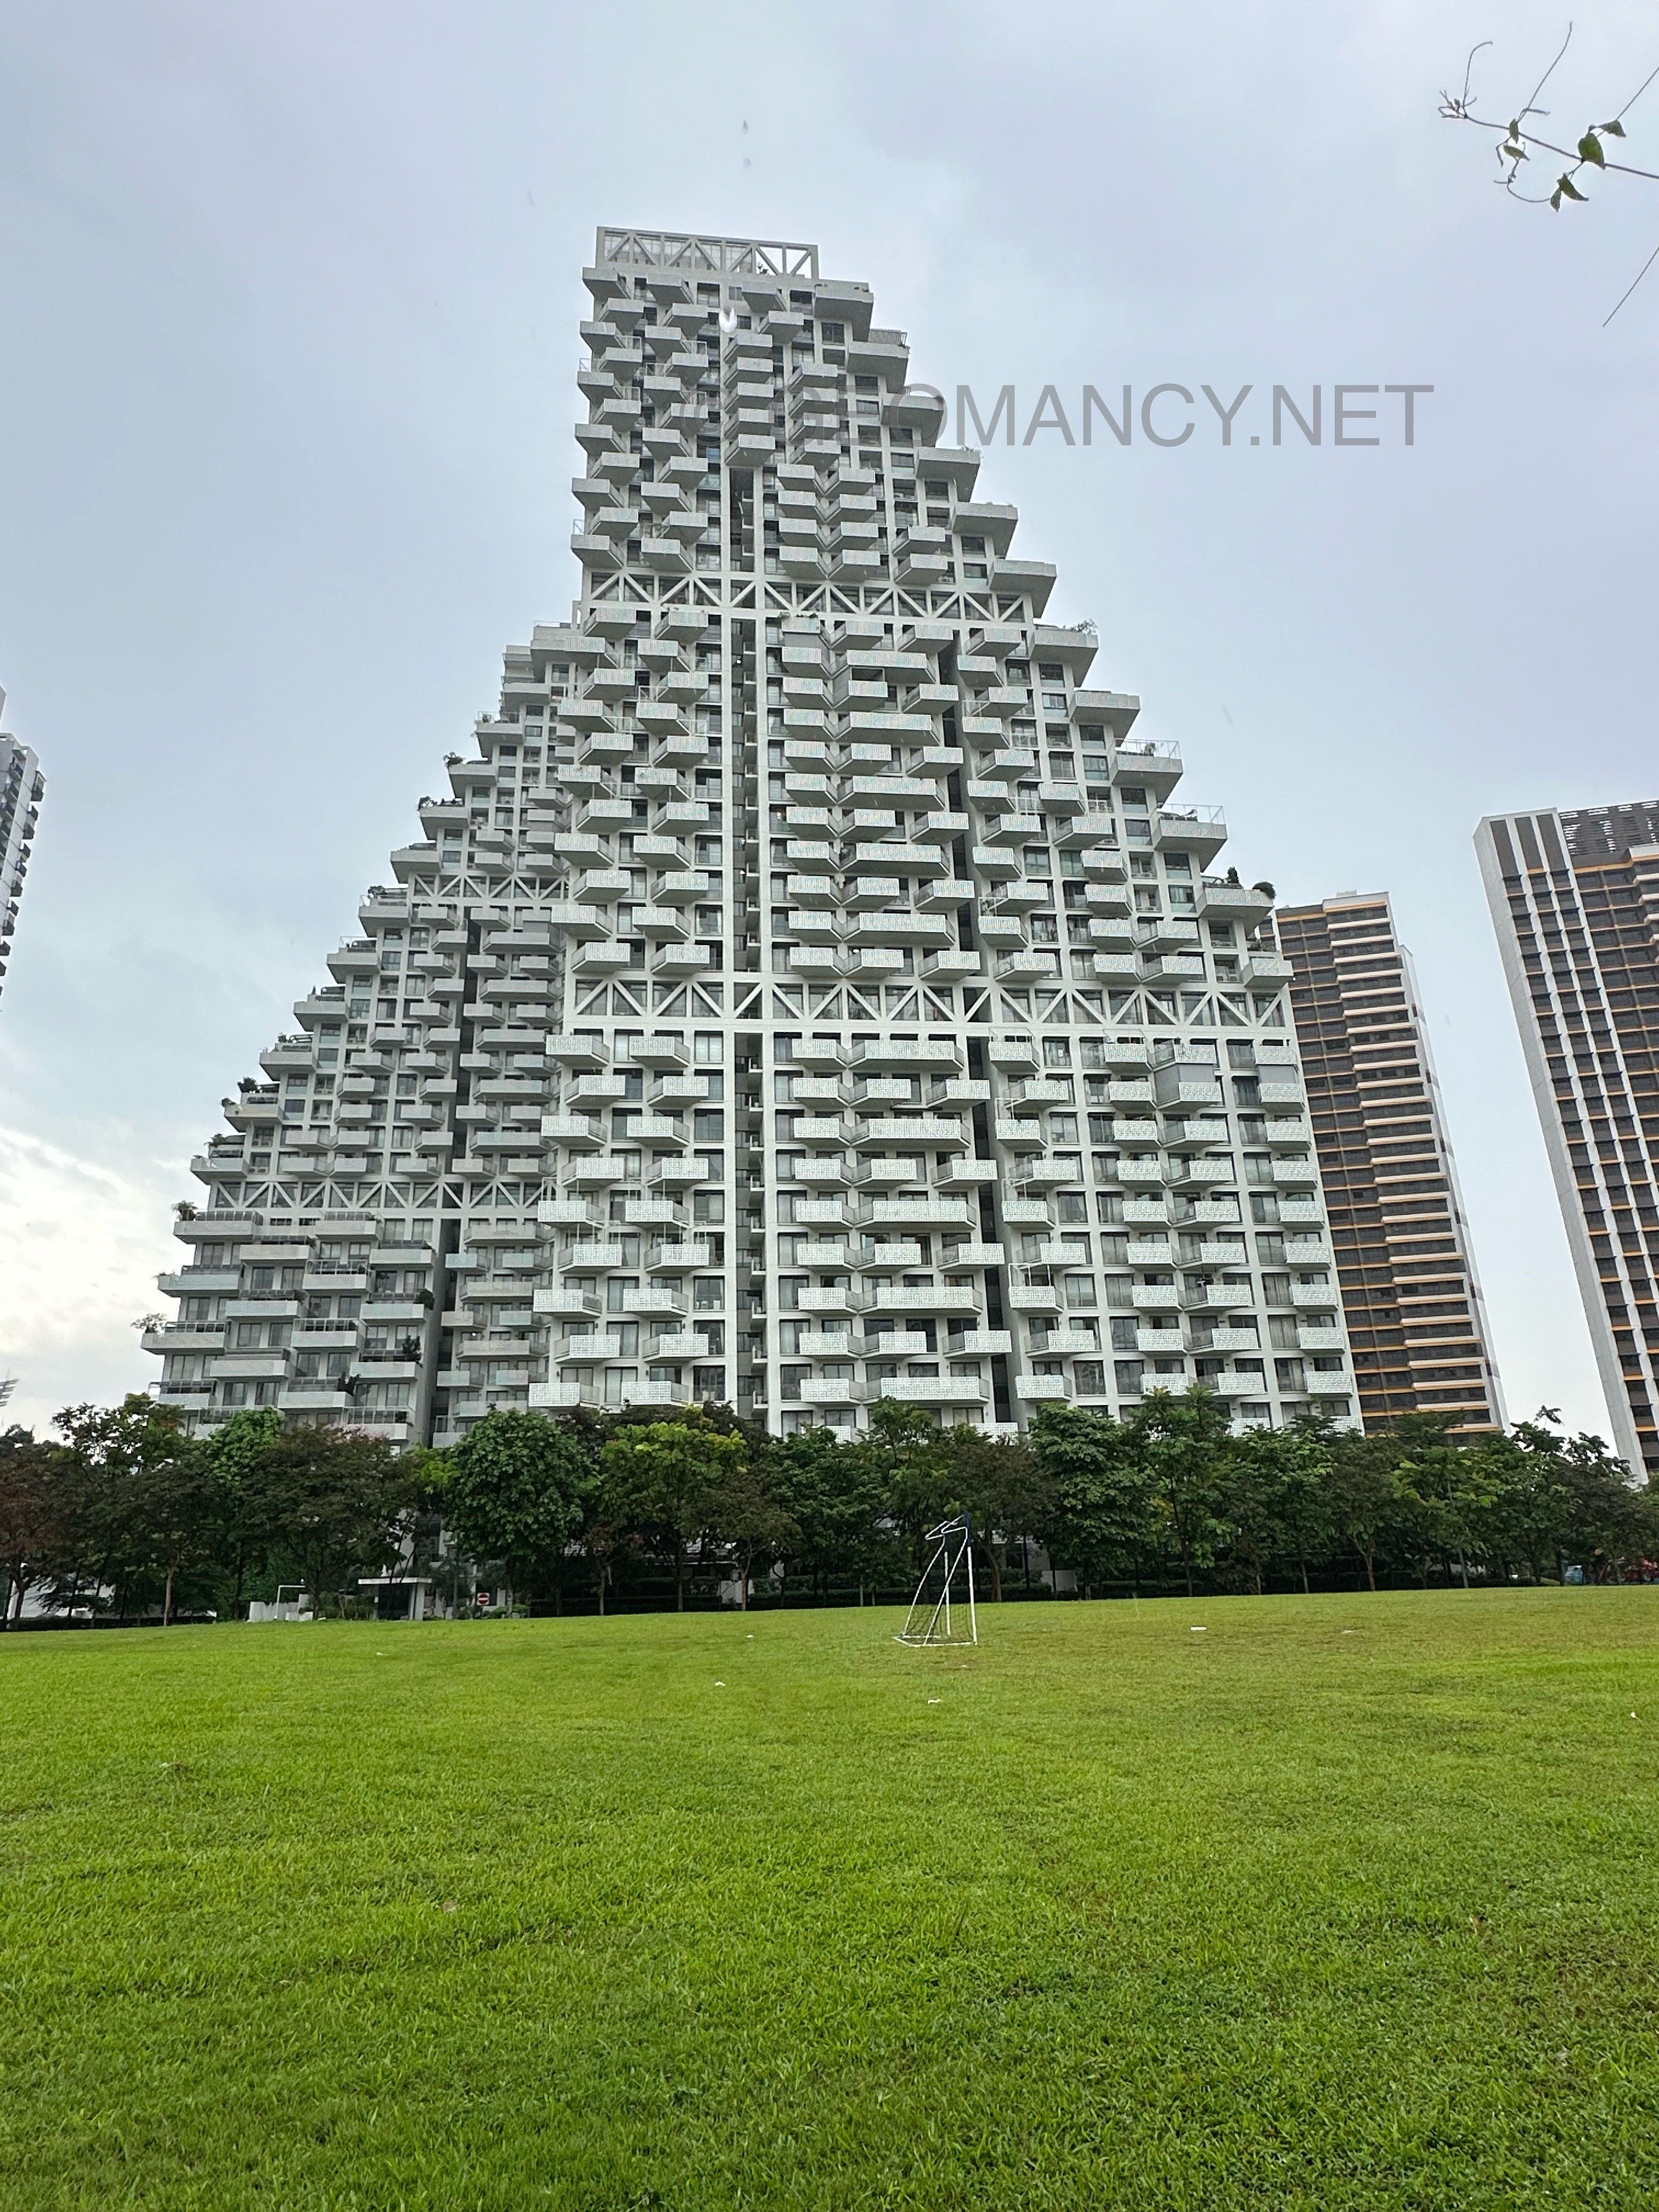
Related: Nearby Neighbour: Sky Habitat Sky Habitat in Bishan - Around Singapore - FengShui.Geomancy.Net
-
New HDB neighbour: HDB Bishan Ridges BTO HDB Bishan Ridges BTO to be launched in November 2020 + Which units are lucky? - Page 2 - Singapore Property Reviews - FengShui.Geomancy.Net
-
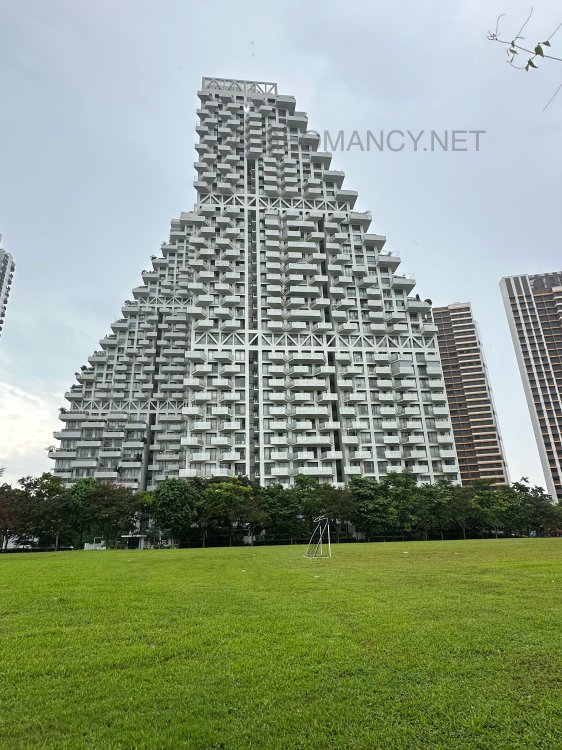
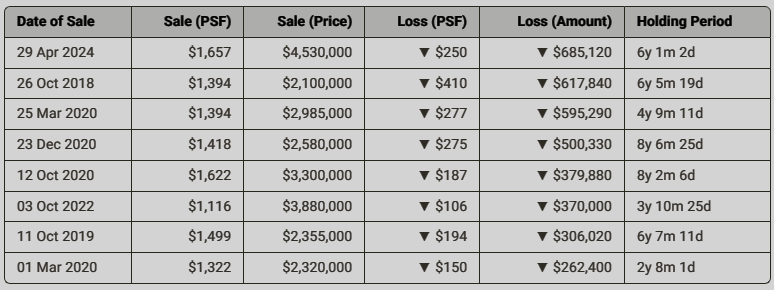
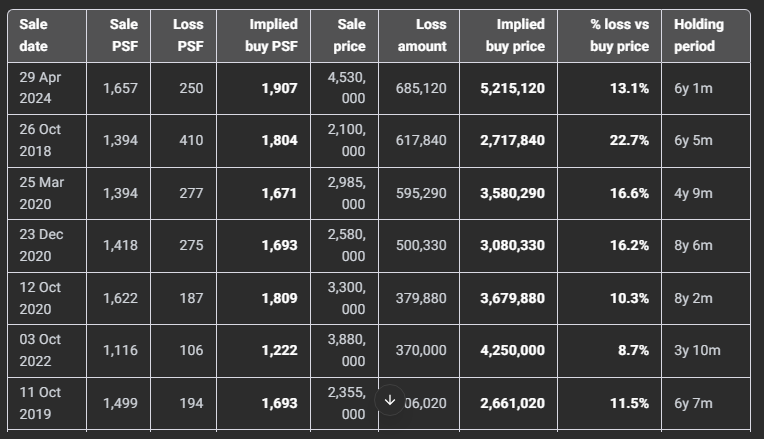
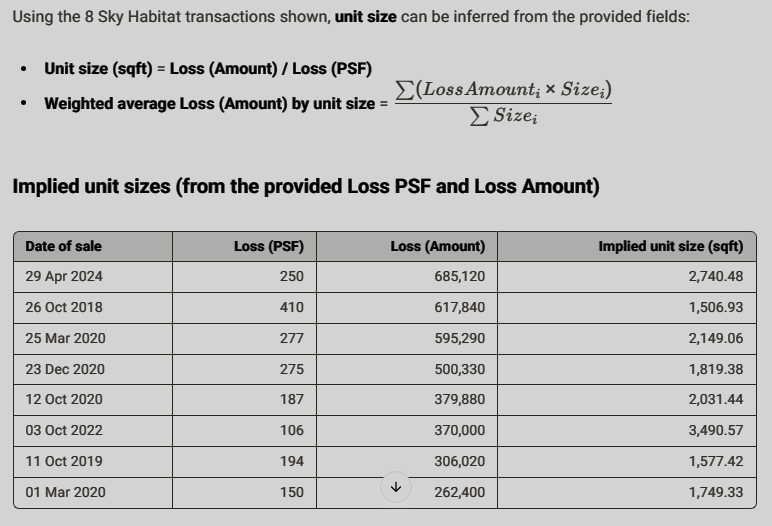
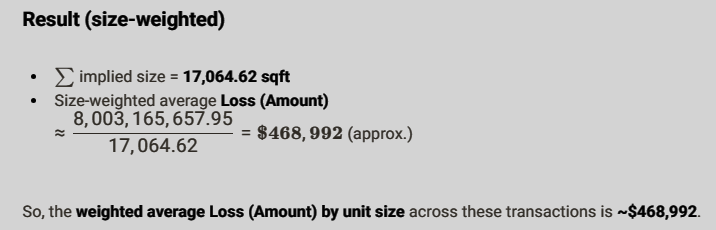
Sky HabitatSky Habitat is a residential condominium development in Bishan, Singapore, known for its “sky village” concept: two high-rise towers connected by multiple elevated sky bridges and landscaped sky terraces. The design emphasizes communal spaces in the sky, greenery, and airflow/light, aiming to create a more open, resort-like living environment while still being a dense urban project. It includes typical condo facilities (pools, gyms, landscaped grounds) and is notable for its distinctive architecture compared with many standard high-rises. Sky Habitat is widely reported to have won the World Building of the Year at the World Architecture Festival (WAF) in 2015. +++ Sky Habitat Resale Profitability Analysis (Oct 2018–Apr 2024): 8 Unprofitable Transactions, Size‑Weighted Average Loss ≈ $468,992 Based on the 8 “Unprofitable Transactions” shown (from 26 Oct 2018 to 29 Apr 2024), every recorded resale in this sample was loss-making. 1) Overall profitability - Win rate: 0/8 profitable (0%) - Total gross loss (sum of “Loss (Amount)”) $3,716,880 - Average loss per transaction: $464,610 - Median loss per transaction: $440,105 - Loss (PSF): - Average: ~$231 psf - Range:* $106 psf to $410 psf - Holding period: roughly 2y 8m → 8y 6m (average ≈ 5y 10m) > Note: These are gross price losses based on the table. Net losses would typically be worse after stamp duties, agent fees, legal fees, interest, etc. 2) Deal-by-deal losses and implied purchase prices Loss (PSF) implies the original buy PSF ≈ Sale PSF + Loss PSF. Likewise, implied purchase price ≈ Sale Price + Loss Amount. 3) What this says about profitability at Sky Habitat (from this dataset) - Losses are persistent across long holding periods (many are ~6–8 years), indicating the resale prices in these cases did not recover to their entry levels. - The largest % loss in the sample is 26 Oct 2018 (~22.7%), also the worst Loss (PSF) at $410 psf. - The largest absolute loss is 29 Apr 2024 (-$685,120), even though its loss-per-sf is not the worst—suggesting it was likely a larger unit size. - Implied entry prices cluster around ~$1,670–$1,810 psf for many earlier buys, while observed sale PSFs range $1,116–$1,657, leaving owners selling below their original purchase levels. Since 1996 (C) Geomancy.net